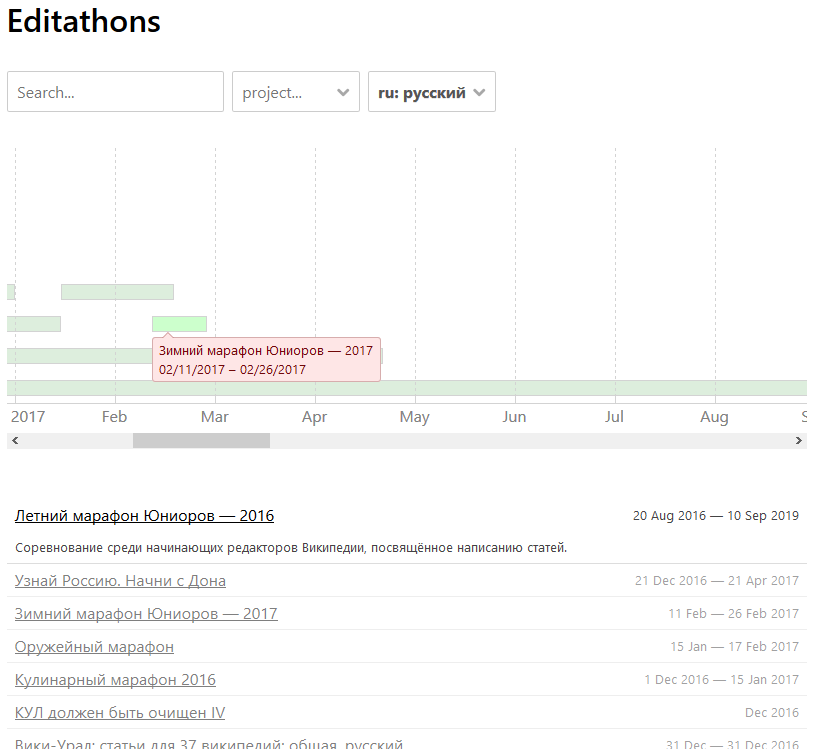
The image shows a screenshot of a dashboard with a gantt chart in WordPress, displaying a timeline of a project.
Read full description
The image shows a screenshot of a dashboard with a gantt chart in WordPress, displaying a timeline of a project. The chart is composed of a series of bars, each representing a different period of time, with the height of each bar indicating the start and end dates of the project. At the top of the chart, there is text that provides further information about the project, such as the date, time, and location.