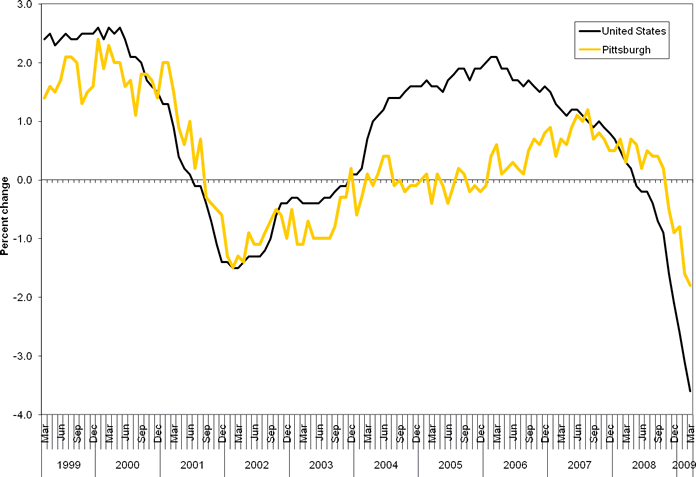
The image shows a graph on a white background with text that reads "U.S.
Read full description
The image shows a graph on a white background with text that reads "U.S. Treasury Bonds" and a line graph depicting the number of bonds in the United States. The graph is composed of two lines, one in blue and one in yellow, that represent the bonds over time. The blue line is steadily increasing, while the yellow line is decreasing, indicating a decrease in the bonds. The text on the white background provides additional information about the graph, such as the source of the data.