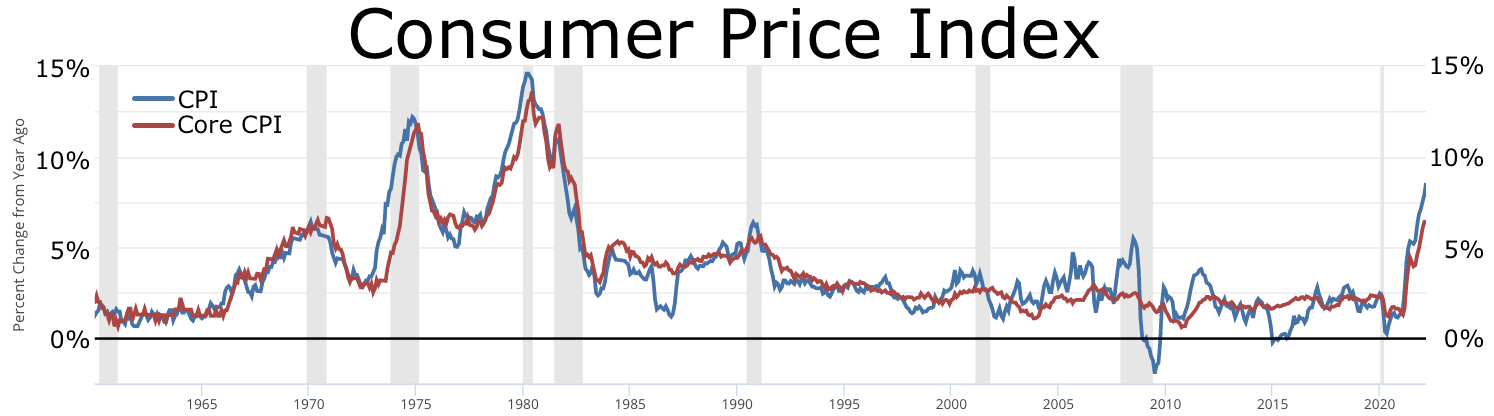
The image shows a graph of the consumer price index, with the text "consumer price index" at the top.
Read full description
The image shows a graph of the consumer price index, with the text "consumer price index" at the top. The graph displays the index over a period of time, with different colors representing the different levels of consumer price. The colors range from light blue to dark blue, with darker blue indicating higher prices. The x-axis of the graph shows the time period, while the y-axis shows the price index.