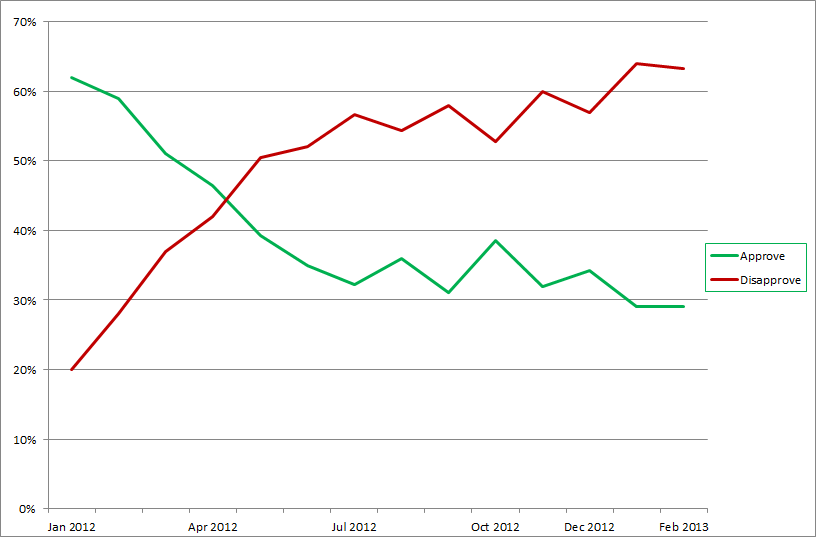
The image shows a line graph on a white background with text that reads "Approve and Disapprove in the UK".
Read full description
The image shows a line graph on a white background with text that reads "Approve and Disapprove in the UK". The graph is composed of two lines, one in red and one in green, that represent the number of people who have been diagnosed with cancer. The red line is slightly higher than the green line, indicating a decrease in the percentage of people diagnosed with the disease. The text is written in black font and is centered on the graph.