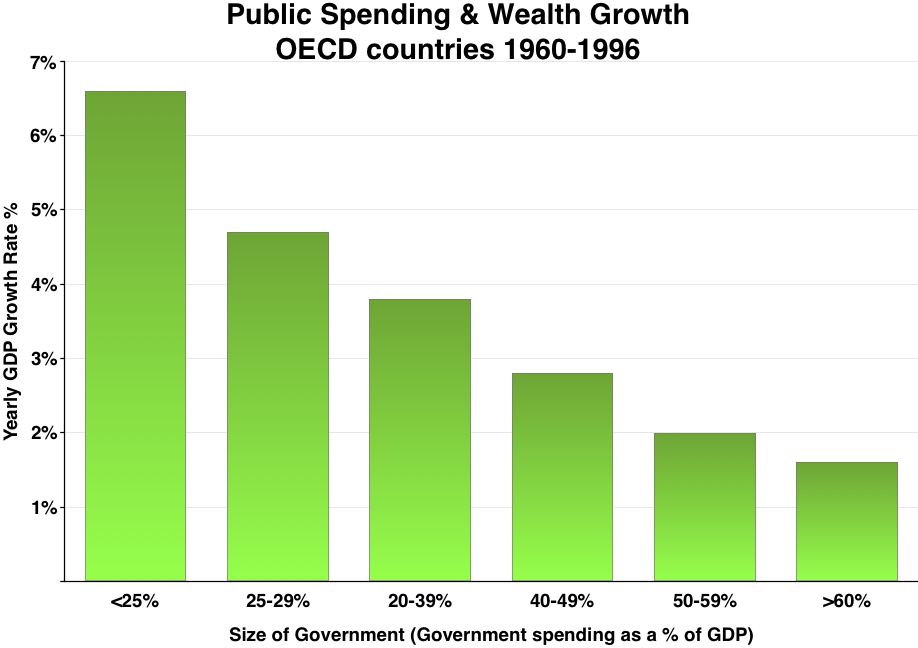
The image shows a bar chart depicting the public spending and wealth growth of OECD countries from 1960 to 1996.
Read full description
The image shows a bar chart depicting the public spending and wealth growth of OECD countries from 1960 to 1996. The chart is composed of several bars of varying heights, each representing a different country, with the height of each bar indicating the amount of money spent on each country. The text at the top of the chart reads "Public Spending & Wealth Growth OECD Countries 1960-1996".