Public domain photos
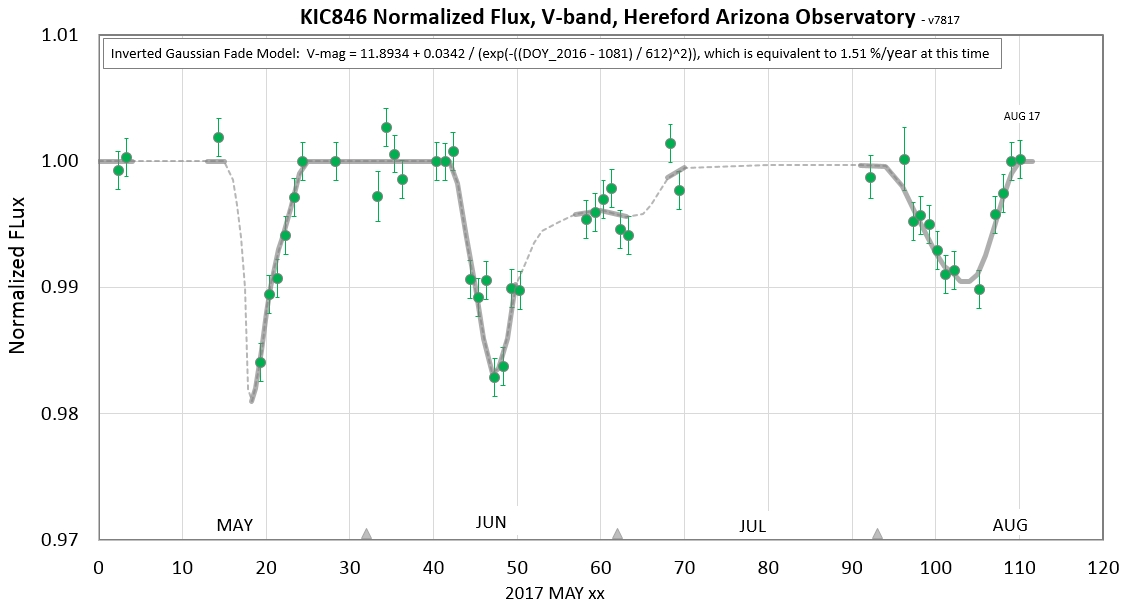
The image shows a plot of the normalized flux of the KIC846 V-band in the Hereford Arizona Observatory. The plot is composed of a series of points connected by a line, with the x-axis representing the time period and the y-axis indicating the frequency of the flux. The points are labeled with the corresponding values, and the plot also includes a legend that explains the meaning of each point.
 Open in library