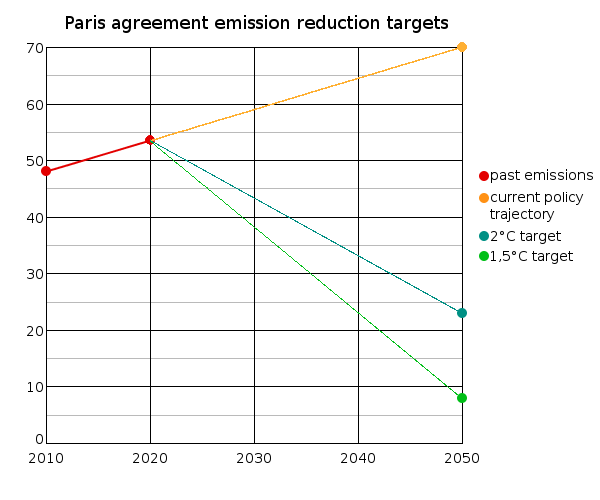
The image shows a graph depicting the Paris Agreement emission reduction targets.
Read full description
The image shows a graph depicting the Paris Agreement emission reduction targets. The graph is composed of two lines, one in blue and one in green, that represent the emissions reduction target. The blue line is labeled "Paris Agreement" and the green line is labelled "Emission Reduction Target". The graph shows a steady increase in emissions over time, indicating that the agreement has been successful.