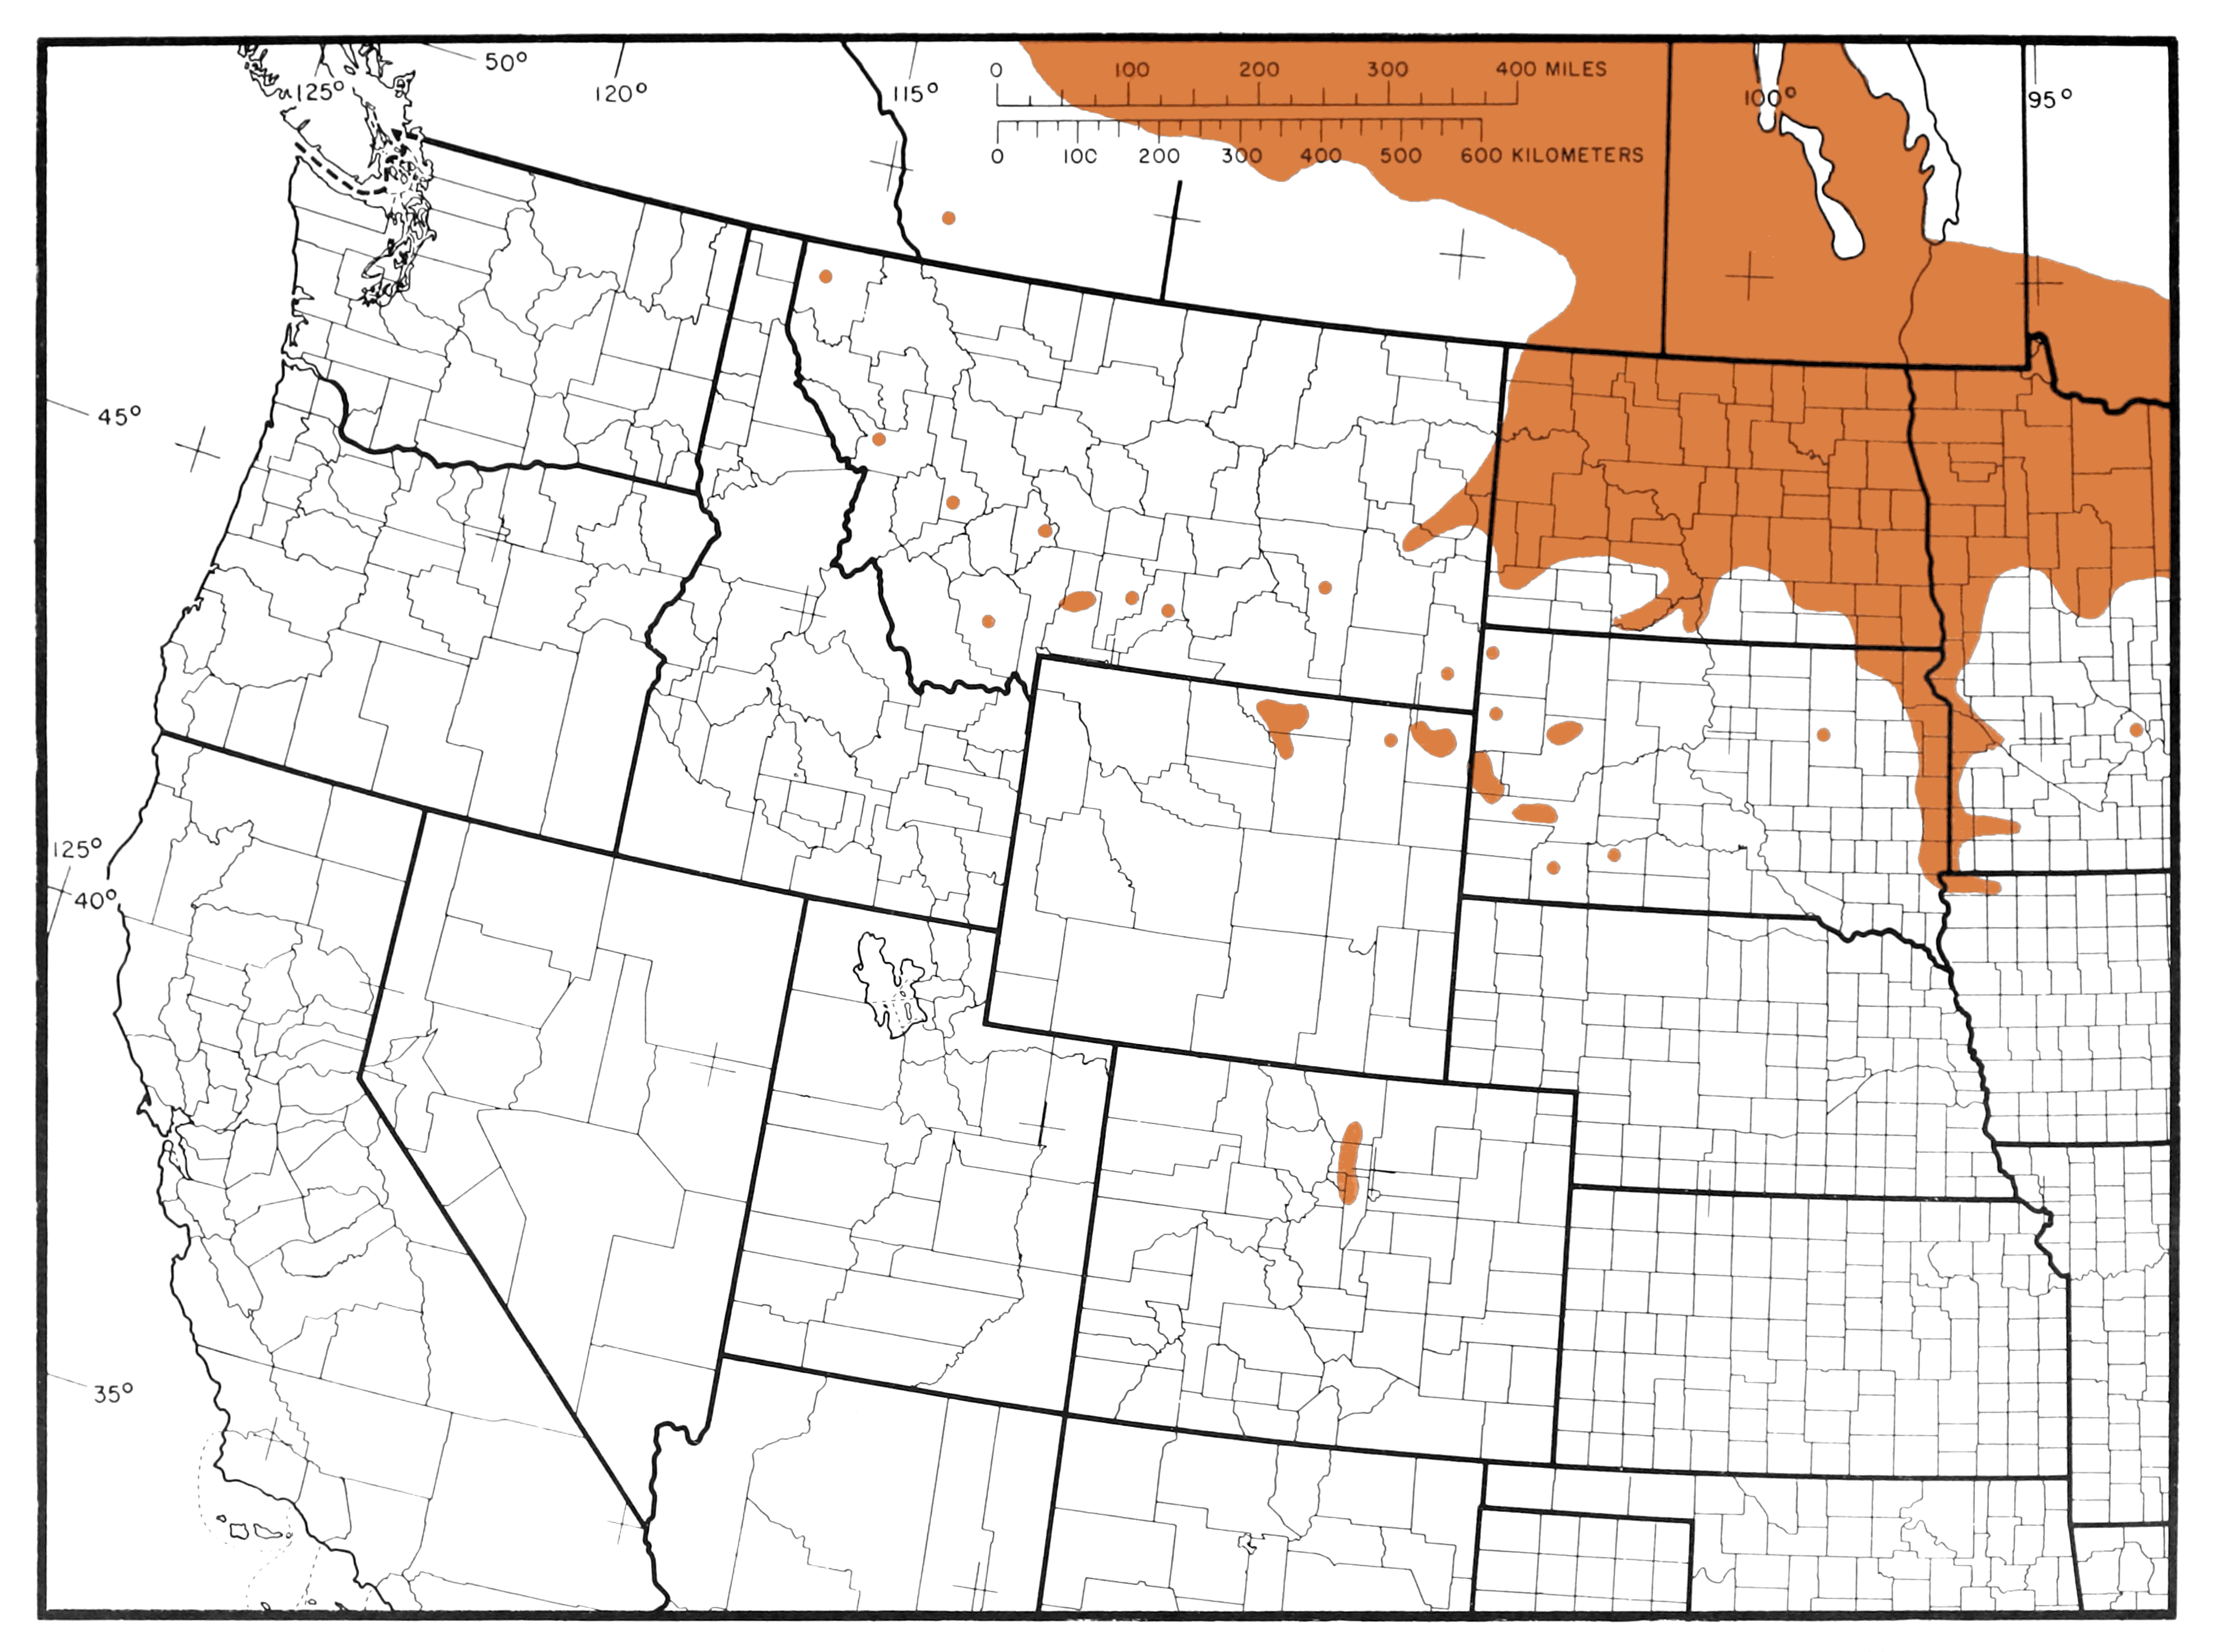
The image shows a map of the United States with the distribution of the number of people living in each state.
Read full description
The image shows a map of the United States with the distribution of the number of people living in each state. The map is filled with various shades of green, indicating the varying levels of population density in each region. The text on the map provides additional information about the population density, such as the total population density of each state and the average population density.