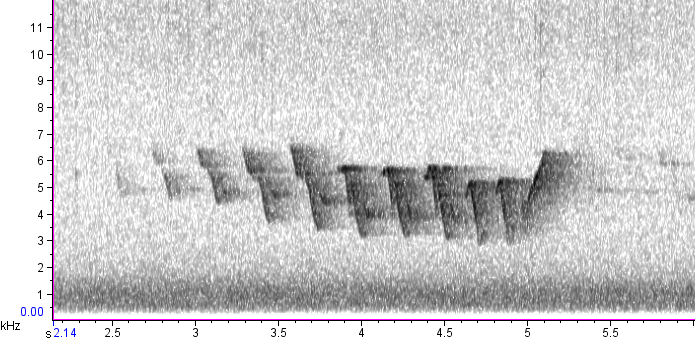
The image shows a black and white plot of a waveform with a line graph in the center.
Read full description
The image shows a black and white plot of a waveform with a line graph in the center. The graph is composed of a series of concentric circles, each representing a different waveform, and the line graph is labeled with numbers at the bottom.