Read full description
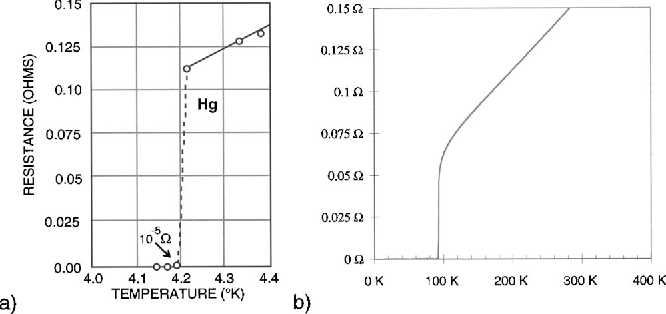
The image shows a plot of the temperature and resistance of a single-phase reactor, with the temperature of the reactor represented by the x-axis and the resistance of the two variables represented by a line graph. The graph is accompanied by text at the top and bottom of the image, providing further information about the reactor's performance.