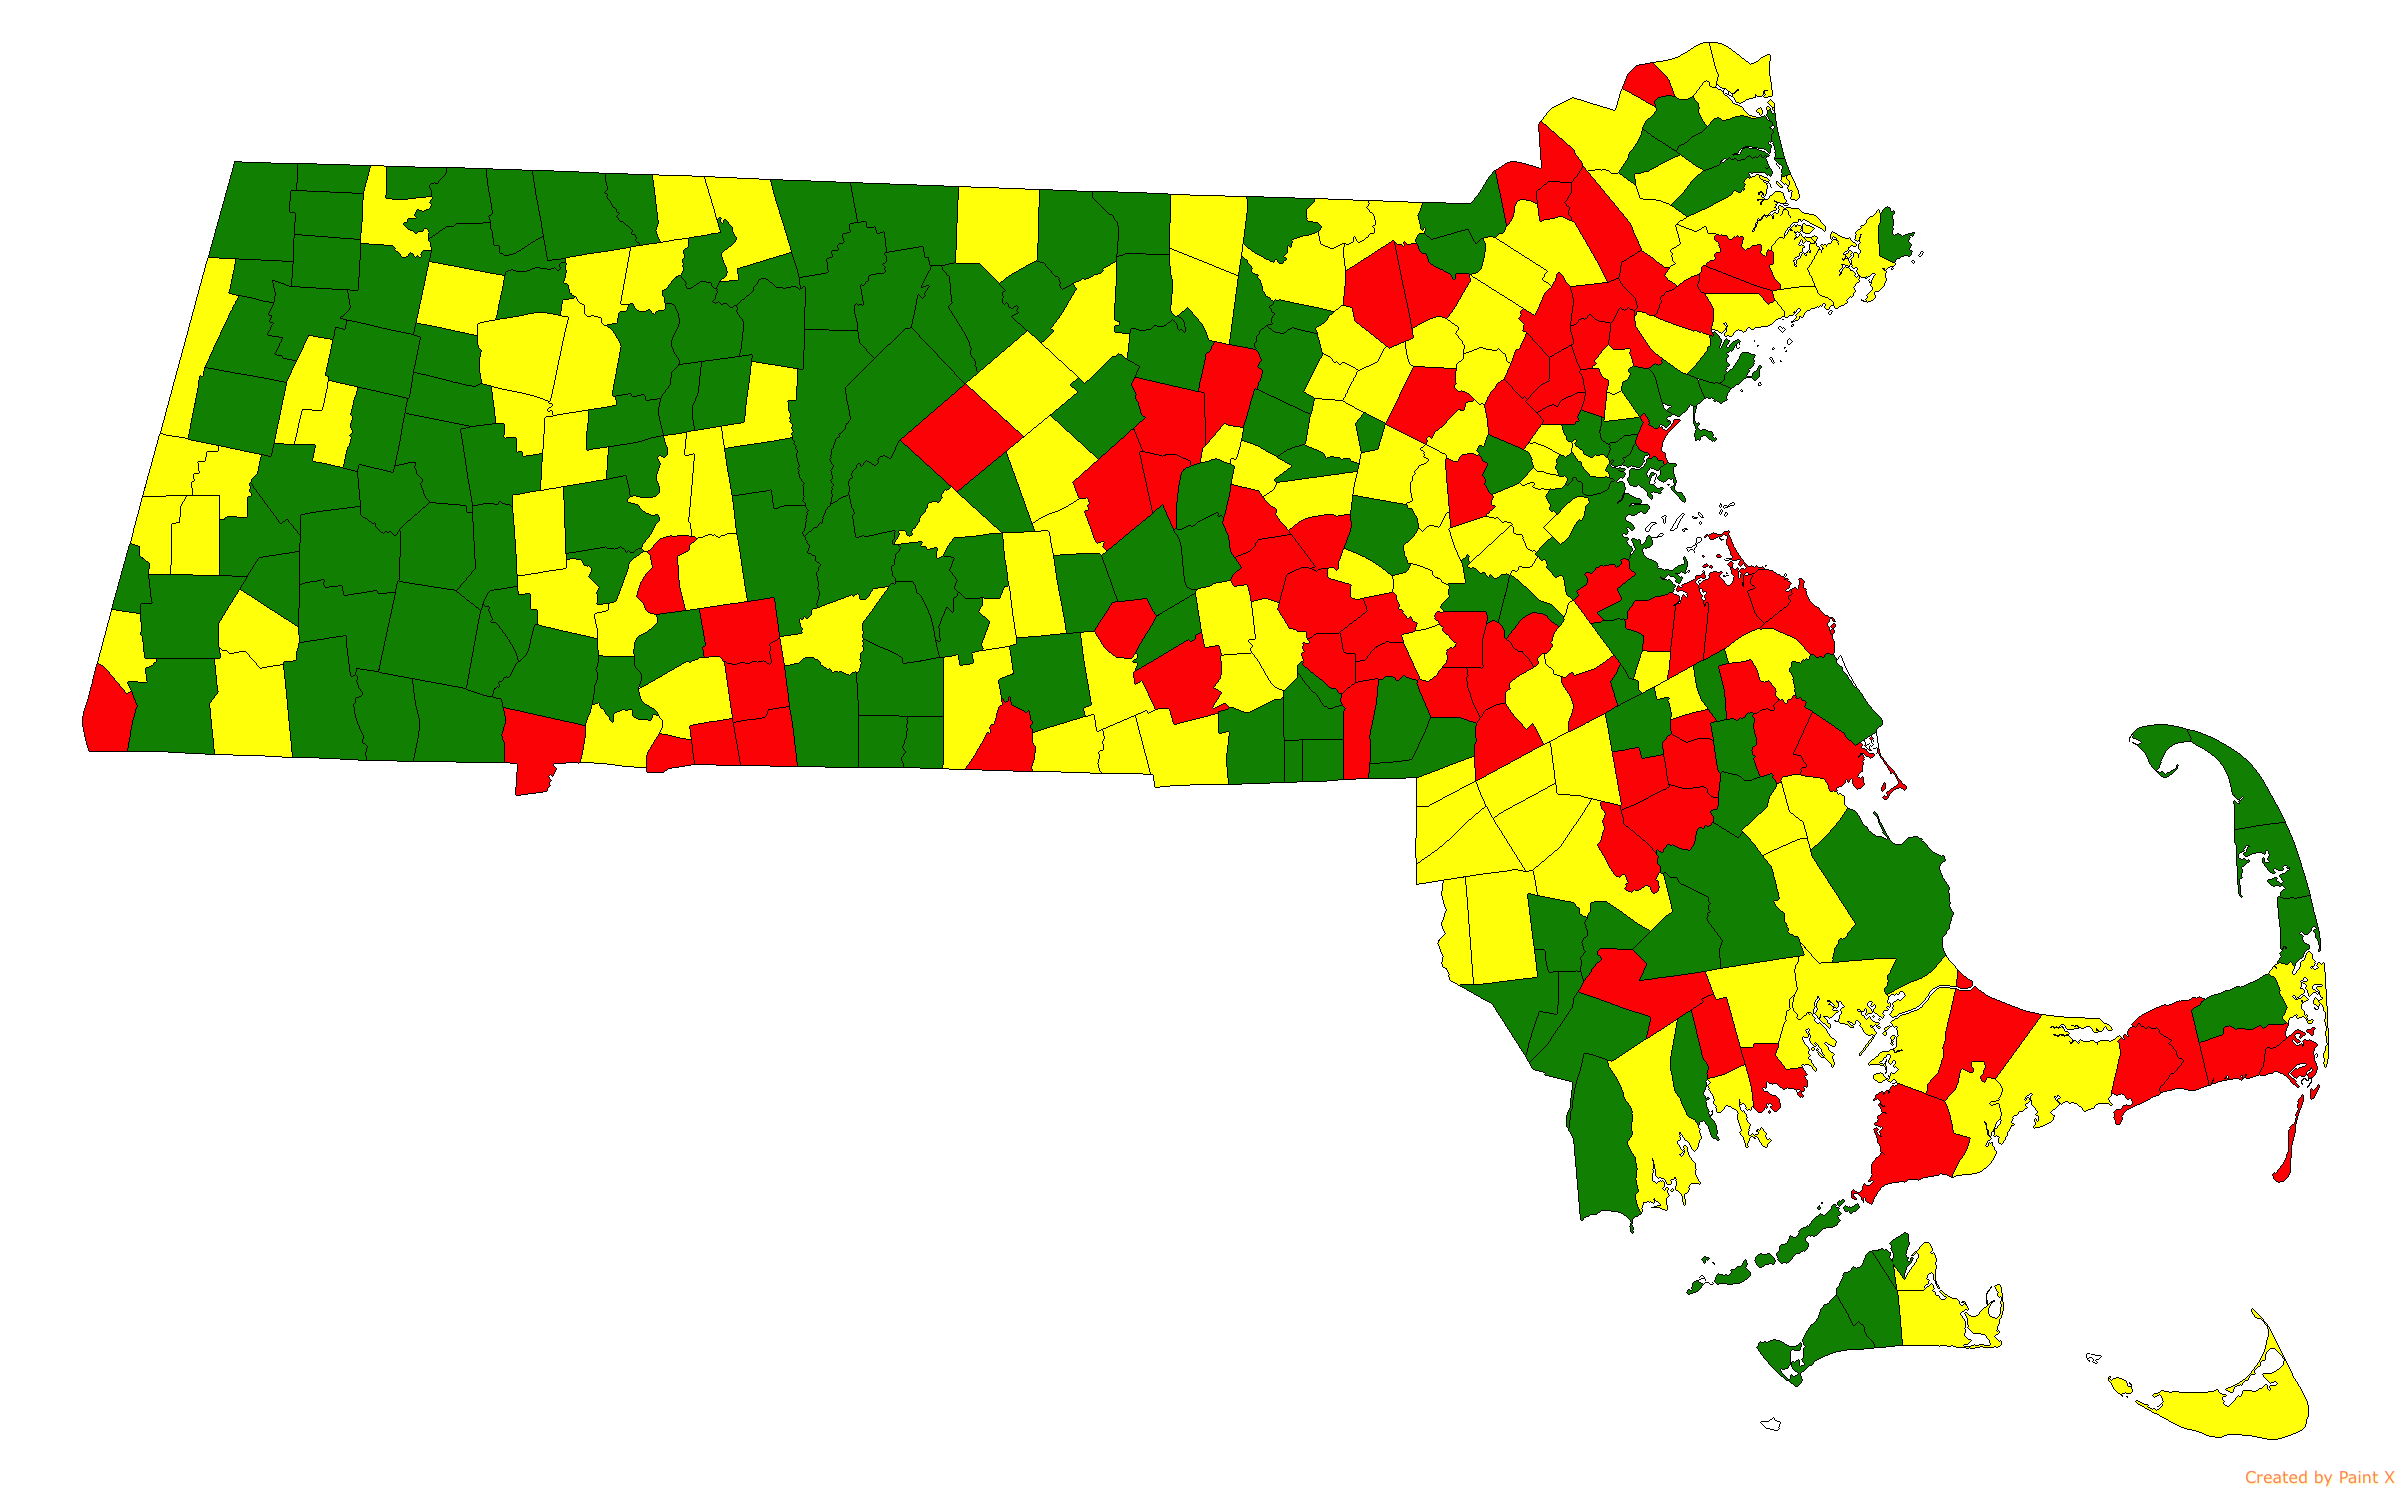
The image shows a map of the state of Massachusetts with different colors indicating the percentage of people living in each state.
Read full description
The image shows a map of the state of Massachusetts with different colors indicating the percentage of people living in each state. The colors range from light yellow to dark green, with the darker green indicating higher percentages. The map also includes text labels for each state, providing further information about the population density.