Public domain photos
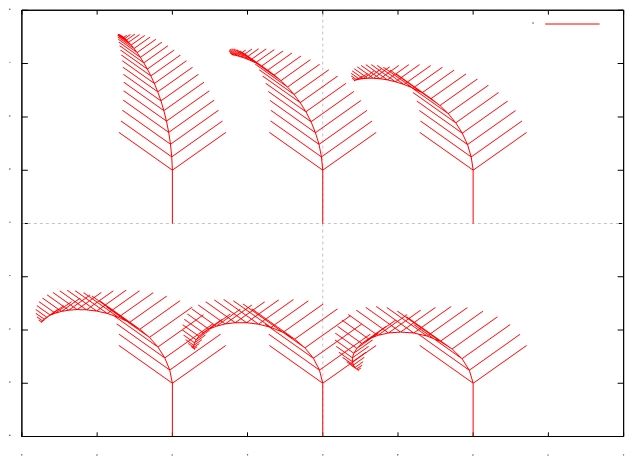
The image shows a plot of a line graph with a red arrow pointing to the left and a white background. The graph is composed of a series of curved lines that represent a waveform, with the x-axis representing the time and the y-axis indicating the waveform. The red arrow indicates the direction of the wave, while the white background provides a stark contrast to the red lines.
 Open in library