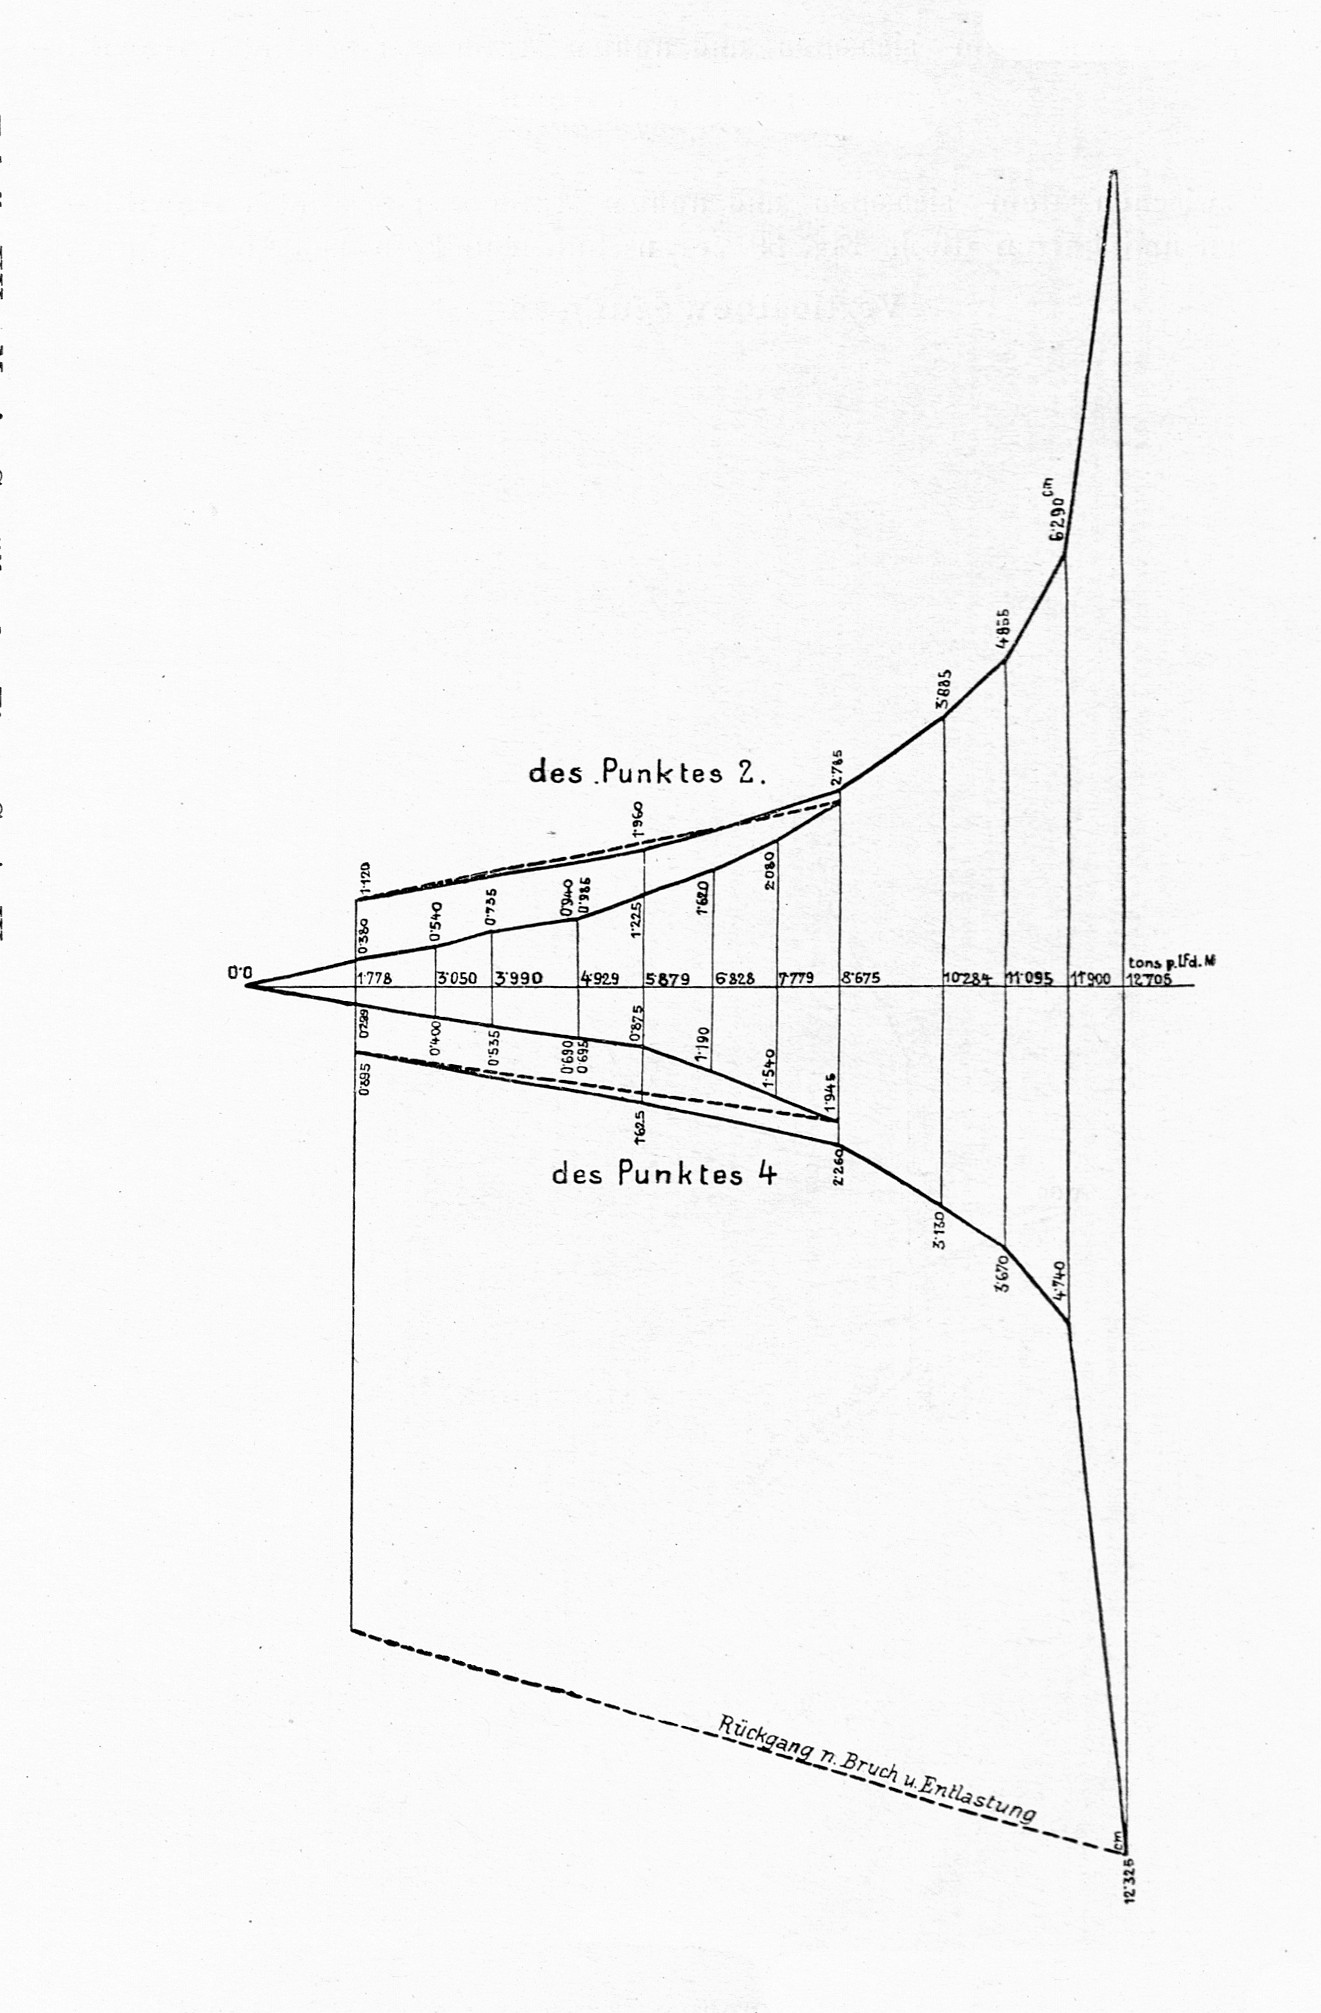
The image shows a graph depicting the relationship between the number of people who have been diagnosed with cancer.
Read full description
The image shows a graph depicting the relationship between the number of people who have been diagnosed with cancer. The graph is composed of a series of points connected by a line, with the x-axis representing the time period and the y-axis indicating the temperature. The points are labeled with the names of the people affected by cancer, and the graph is accompanied by text that provides further information about the data.