Public domain photos
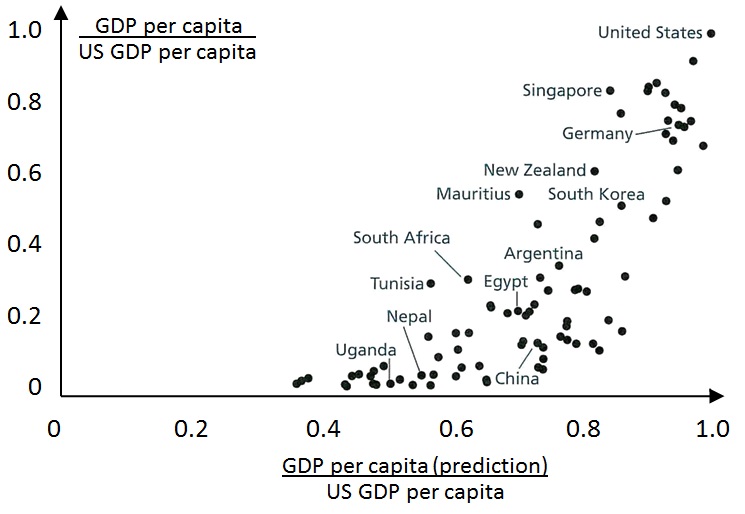
The image shows a scatter plot with black dots on a white background. The text on the image reads "GDP per capita vs US GDP per capita". The dots represent the correlation between the two countries, with the black dots representing the GDP and the white dots representing US GDP.
 Open in library