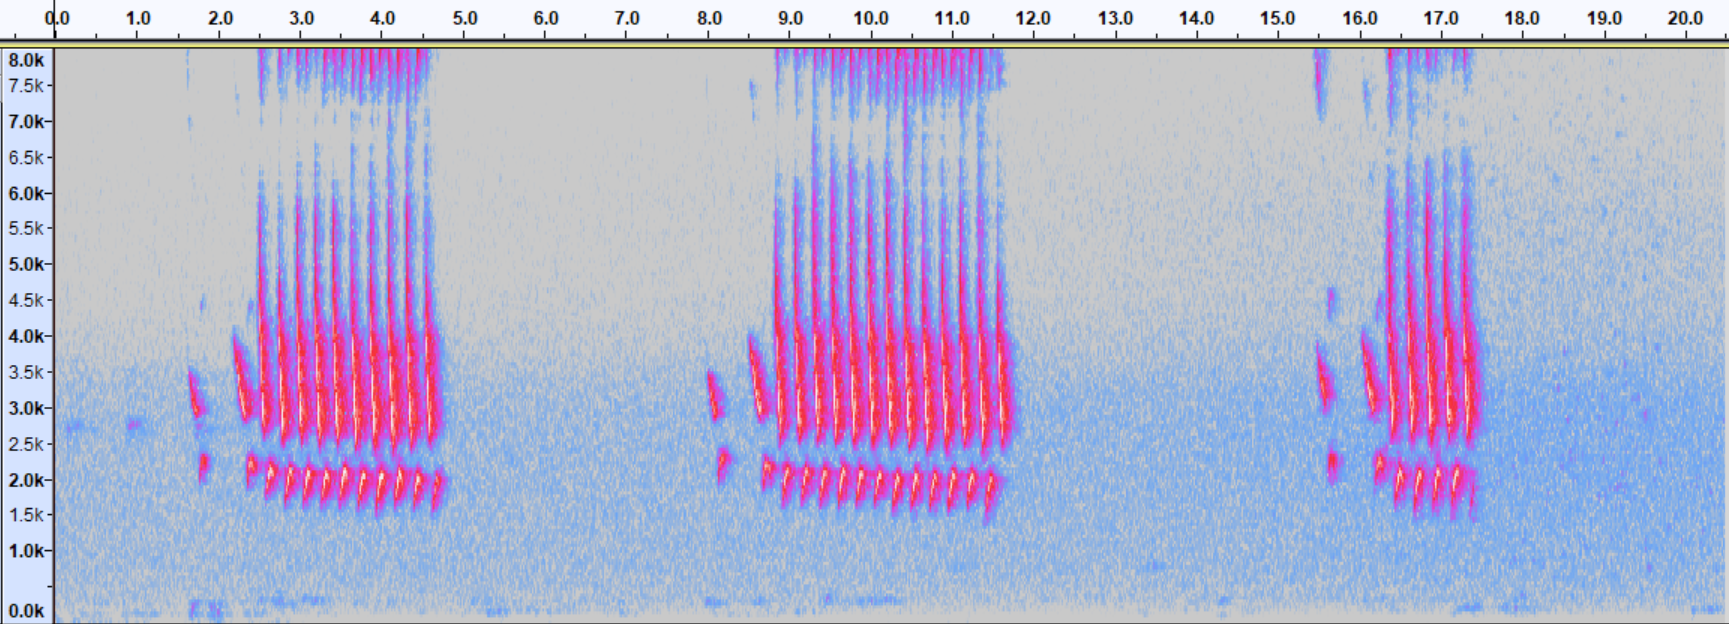
The image shows a plot of a waveform with a red and blue color scheme.
Read full description
The image shows a plot of a waveform with a red and blue color scheme. The plot is composed of two lines, one in red and one in blue, that represent the frequency of the waveform. The red line is slightly larger than the blue line, indicating a higher frequency. The blue line is smaller than the red line, and both lines are connected by a series of points.