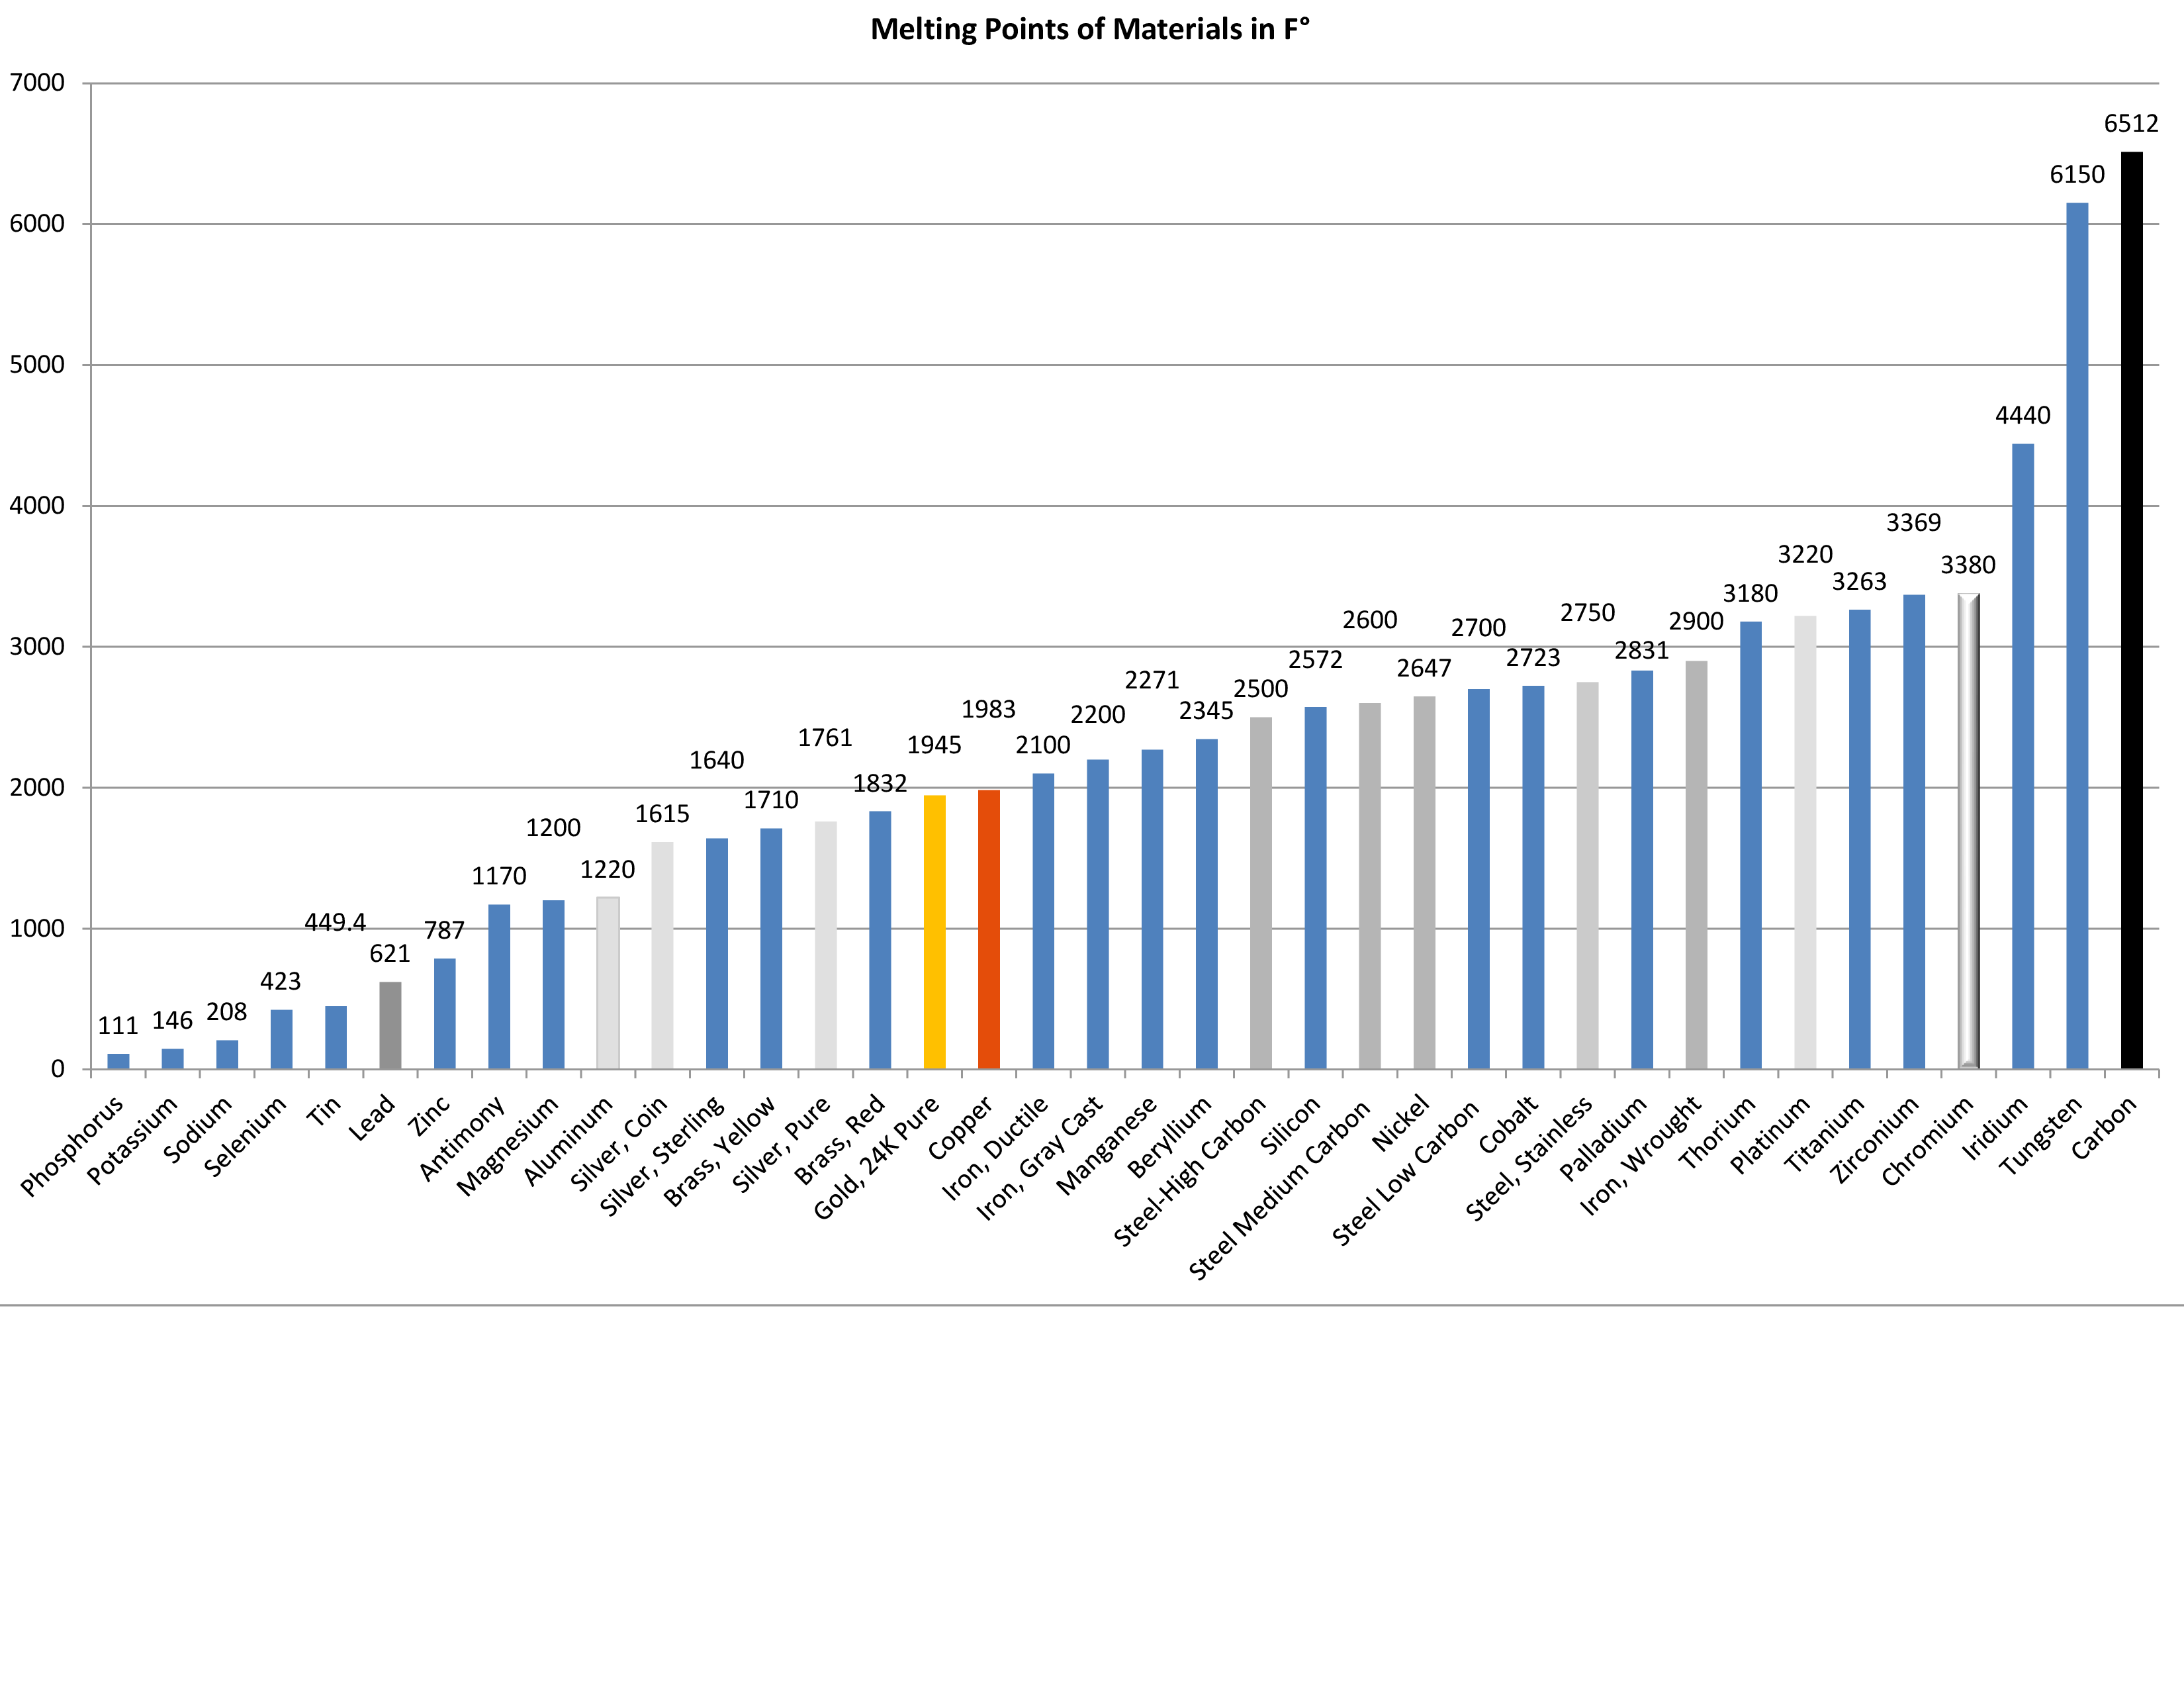
The image shows a bar chart depicting the melting points of materials in the United States.
Read full description
The image shows a bar chart depicting the melting points of materials in the United States. The chart is composed of several bars of varying heights, each representing a different melting point. The colors of the bars range from light blue to dark blue, indicating the amount of melting points. The text on the chart provides further information about the melting point, such as the type of melting point and the number of materials it contains.