Public domain photos
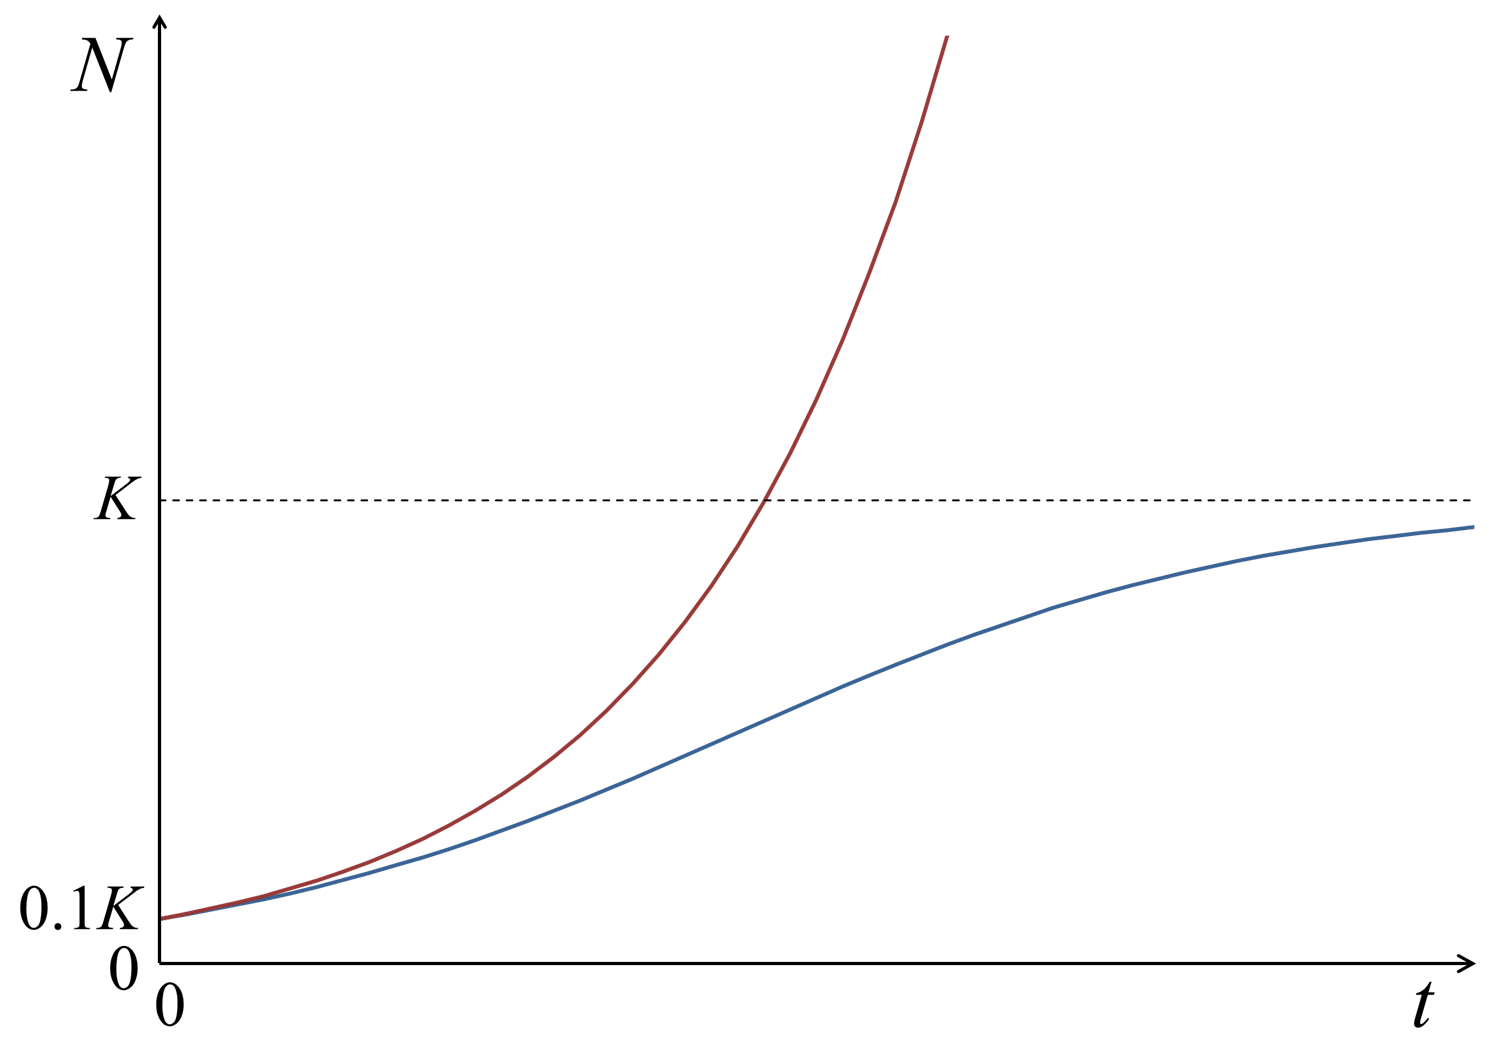
The image shows a graph of the demand curve for a product, with the x-axis representing the quantity of the product and the y-axis indicating the price of the goods. The graph is labeled with the letters 'K' and 'T', indicating the quantity and price of each product.
 Open in library