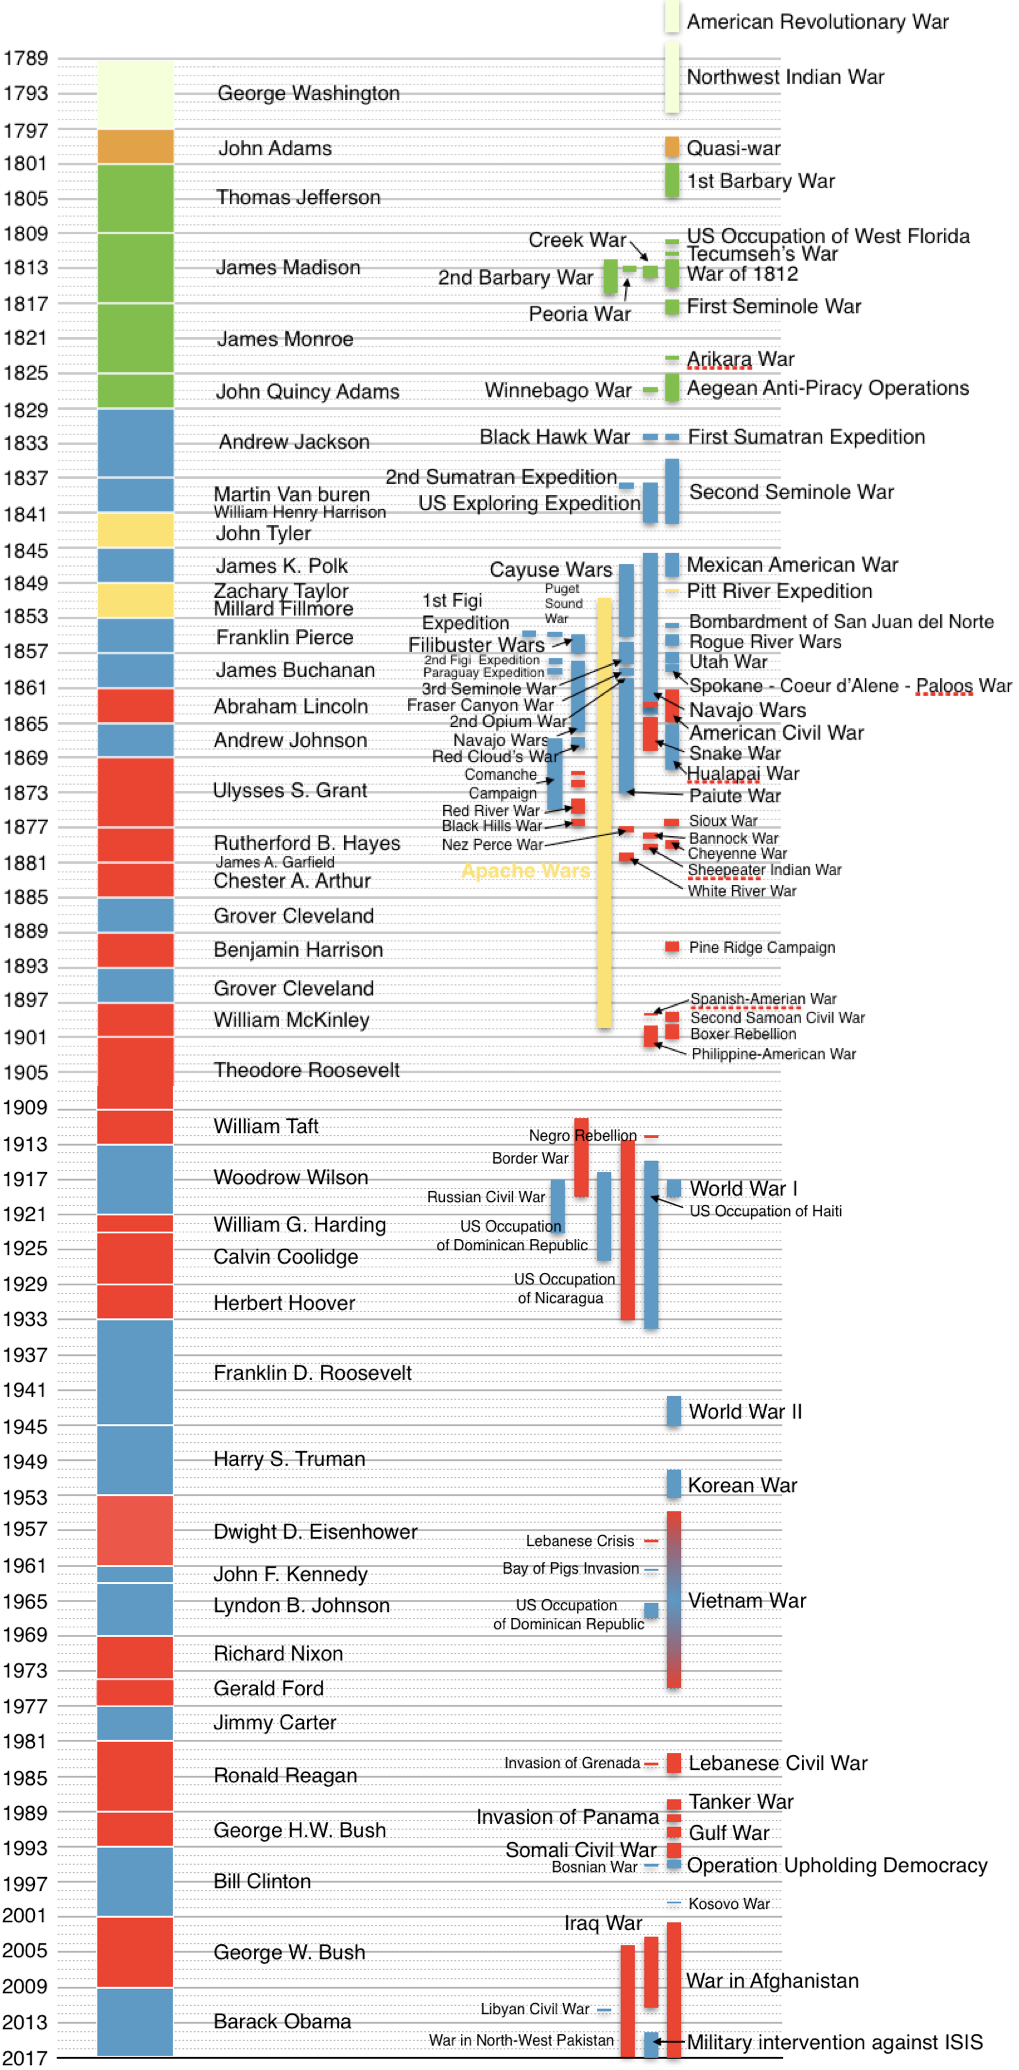
The image shows a bar chart depicting the number of people who have lived in the United States during the Civil War.
Read full description
The image shows a bar chart depicting the number of people who have lived in the United States during the Civil War. The chart is composed of different colored bars, each representing a different period of time, and the height of each bar indicates the percentage of people living in that period. The colors range from light blue to dark blue, with the darker blue representing the highest percentage.