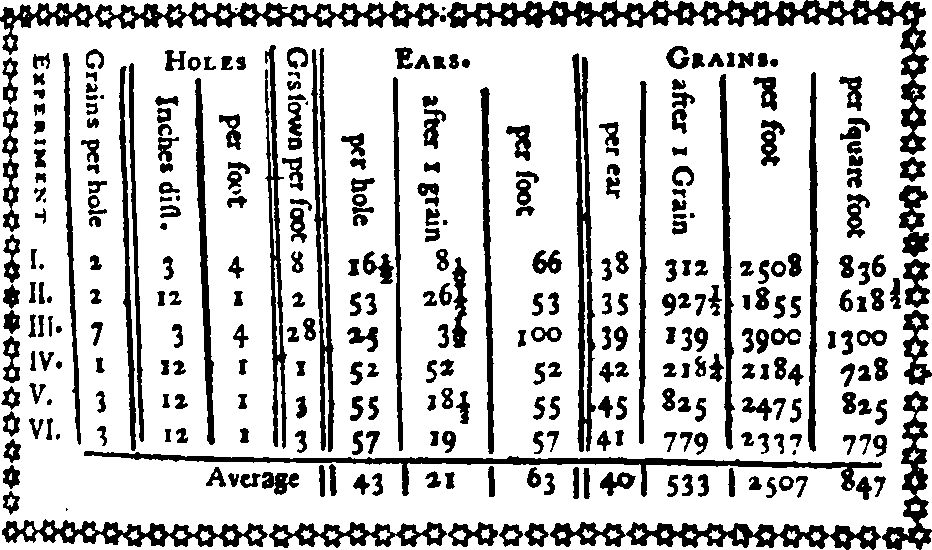
The image shows a black and white drawing of a table with a number of numbers on it, which is likely a grain chart from the early 20th century.
Read full description
The image shows a black and white drawing of a table with a number of numbers on it, which is likely a grain chart from the early 20th century. The chart is composed of a series of columns and rows, with each row representing a different type of grain. The columns are labeled with numbers from 1 to 20, and the rows are filled with numerical values.