Public domain photos
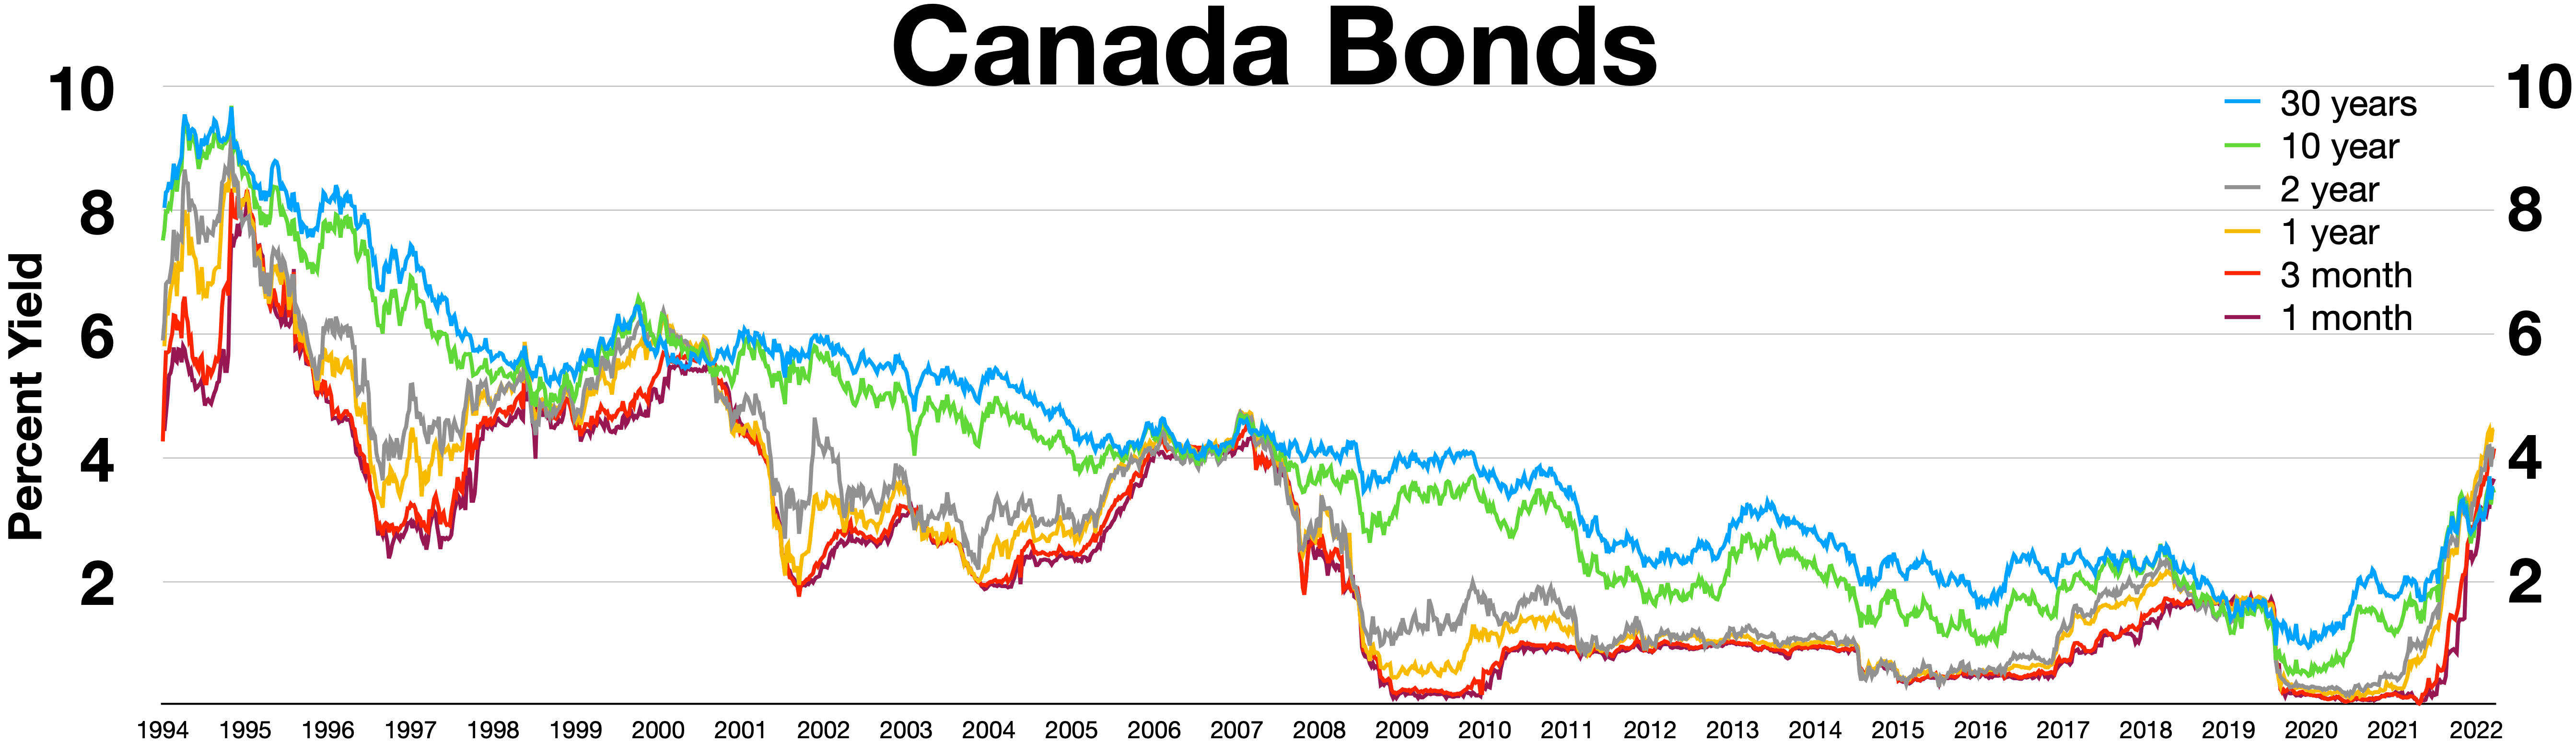
The image shows a graph of Canada's bond yield over time, with different colors representing the different bonds. The graph is accompanied by text that provides further information about the bond yield.
 Open in library
Public domain photos
Open in library