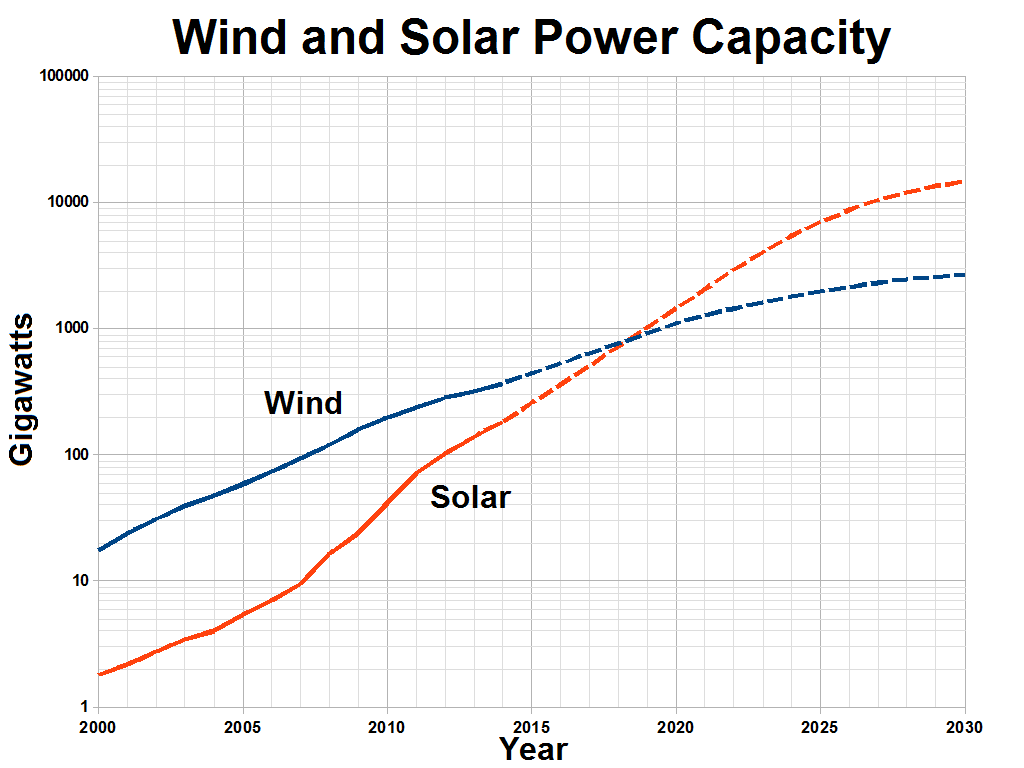
The image shows a graph of wind and solar power capacity, with the text "Wind and Solar Power Capacity" written above it.
Read full description
The image shows a graph of wind and solar power capacity, with the text "Wind and Solar Power Capacity" written above it. The graph is composed of two lines, one in blue and one in red, that represent the different types of wind turbines and solar panels. The blue line represents the wind turbine, while the red line represents solar panels, indicating the power capacity of each type of turbine. The text above the graph provides additional information about the graph, such as the source of the data and the type of solar panels used.