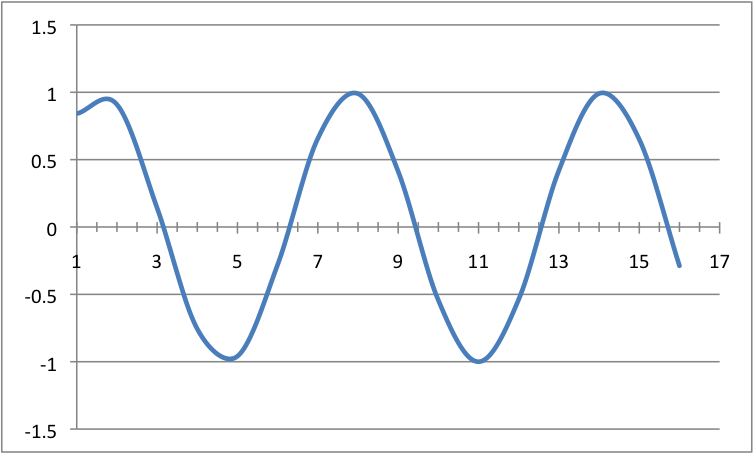
The image shows a graph of a waveform with a blue line on a white background.
Read full description
The image shows a graph of a waveform with a blue line on a white background. The graph is a representation of the frequency of a single-channel amplifier, with the x-axis representing the amplitude and the y-axis indicating the frequency. The blue line is curved and radiates outwards from the center of the graph, creating a wave-like effect.