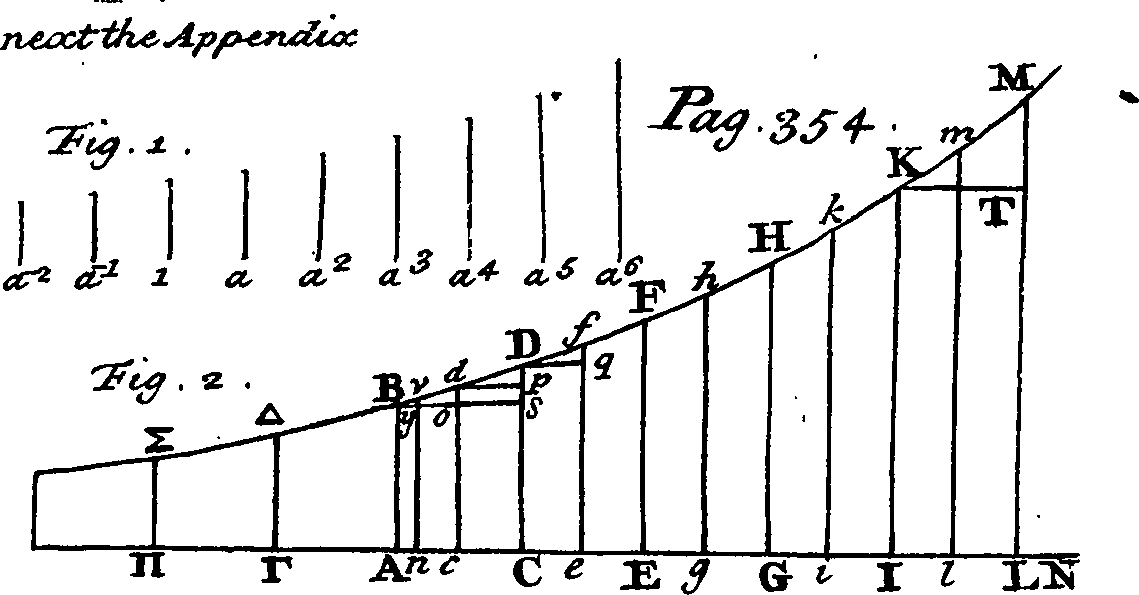
The image shows a diagram of a curve with a line going up and down, and text written on it.
Read full description
The image shows a diagram of a curve with a line going up and down, and text written on it. The text appears to be a mathematical equation, with the x-axis representing the time period and the y-axis indicating the slope of the curve. The graph is composed of a series of points connected by a line, with each point representing a different time period. The points are labeled with numbers and letters, indicating the relationship between the two variables.