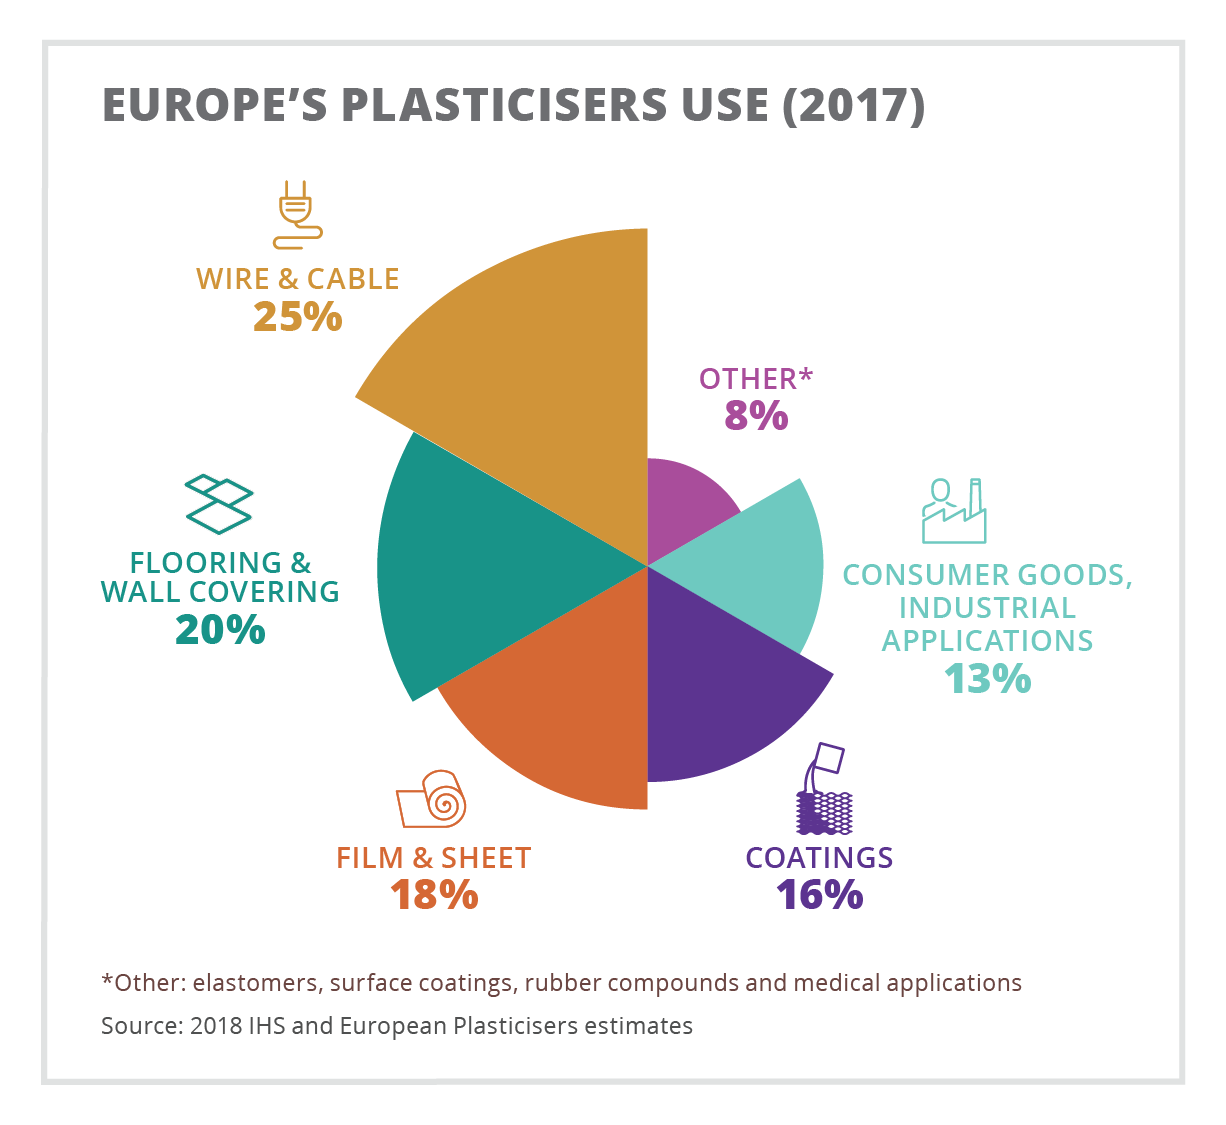
The image shows a pie chart depicting Europe's plasticisers use in 2017.
Read full description
The image shows a pie chart depicting Europe's plasticisers use in 2017. The chart is divided into sections, each representing a different type of plastic, such as flooring, wall covering, film, and sheet. The size of each section indicates the percentage of plastic used in each type.