The image shows a pie chart on a white background with text beside it.
Read full description
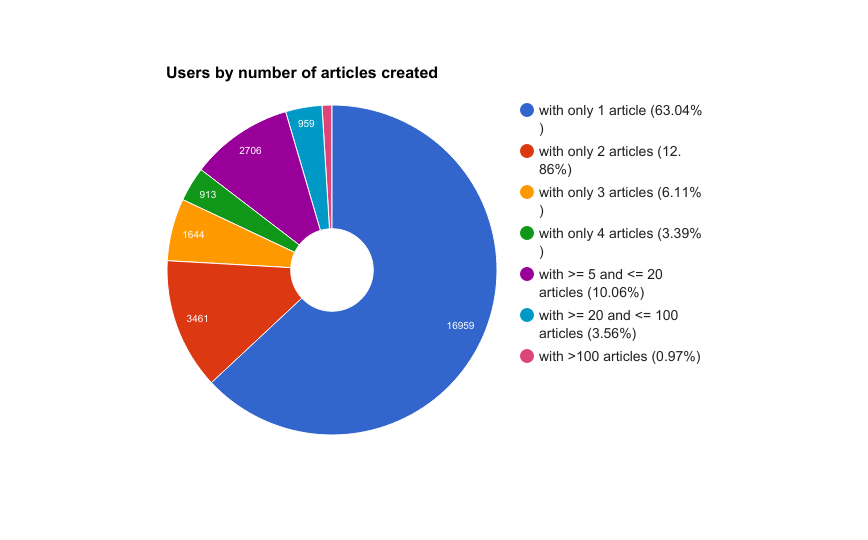
The image shows a pie chart on a white background with text beside it. The chart is divided into sections, each representing a different source of content, such as content creation, content creation statistics, and content creation. The size of each section indicates the percentage of people who have created content.