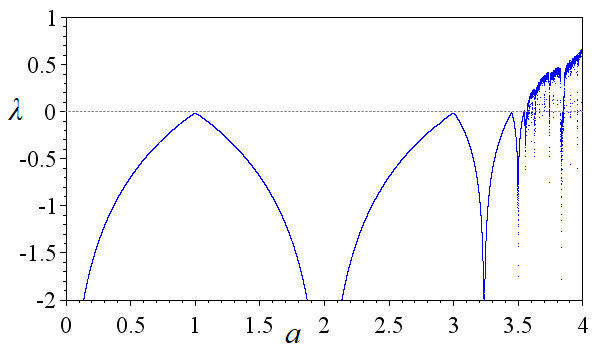
The image shows a plot of a waveform with a blue line and a white background.
Read full description
The image shows a plot of a waveform with a blue line and a white background. The waveform is composed of a series of points connected by a line, with the x-axis representing the time and the y-axis indicating the frequency of the waveform. The blue line is curved and the white background provides a stark contrast to the blue line, making it stand out.