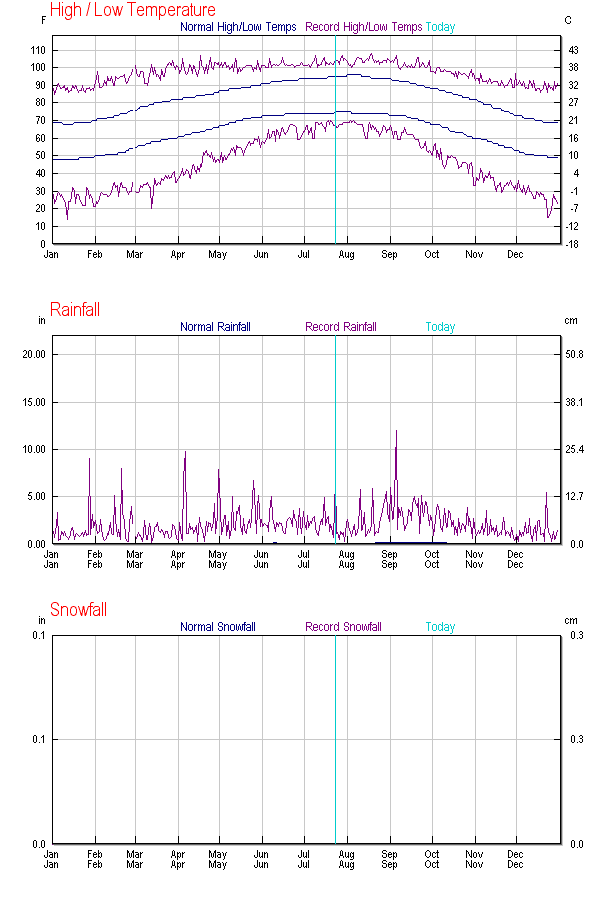
The image shows a graph of the average temperature in the city of San Francisco, California.
Read full description
The image shows a graph of the average temperature in the city of San Francisco, California. The graph is composed of a series of lines that represent the temperature over a period of time, with the x-axis representing the days of the week and the y-axis indicating the temperature range. The text accompanying the graph provides additional information about the data, such as the temperature, humidity, and wind direction.