Read full description
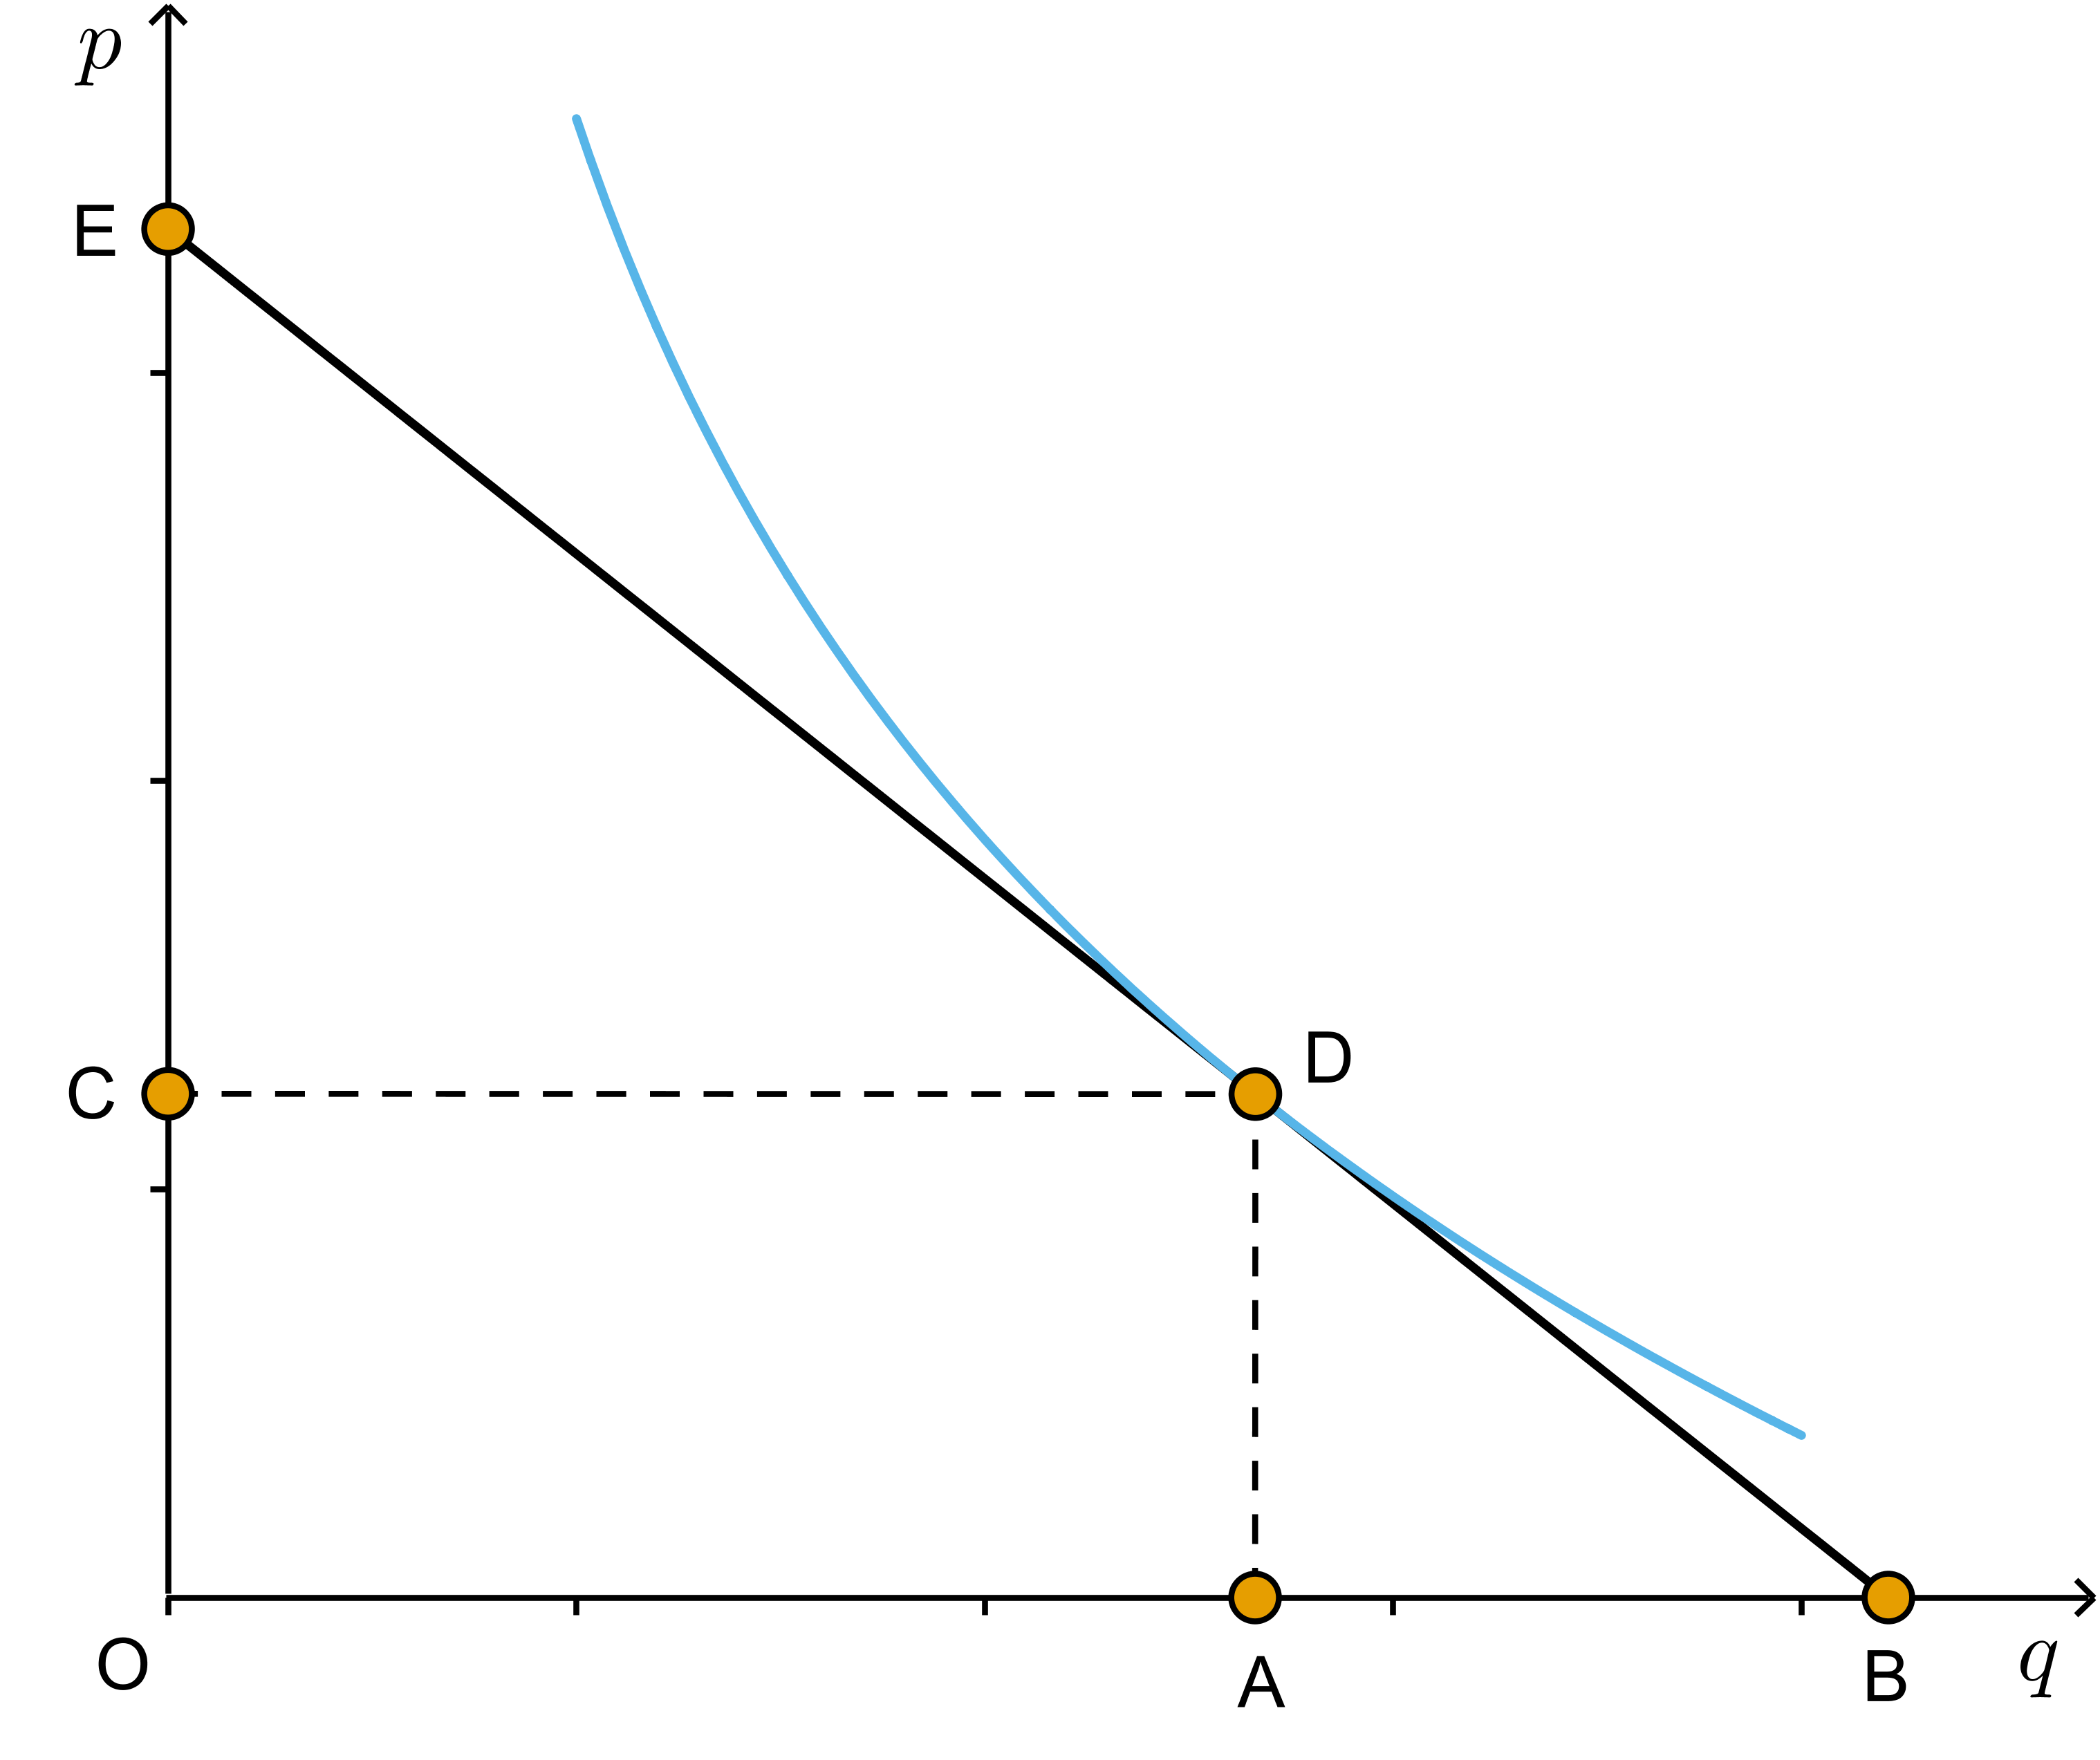
The image shows a graph of the supply and demand curve on a white background, with the x-axis representing the demand curve and the y-axis indicating the price of goods and services. The graph is labeled with the words "Supply and Demand" at the top and bottom.