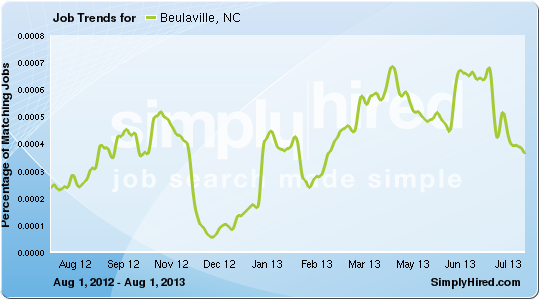
The image shows a graph depicting the job trends for Beaulaville, NC from August 2012 to July 2013.
Read full description
The image shows a graph depicting the job trends for Beaulaville, NC from August 2012 to July 2013. The graph is composed of a series of points connected by a line, with the x-axis representing the months of the year and the y-axis indicating the number of jobs in each month. The text on the graph provides additional information about the data, such as the job title, job description, and other relevant information.