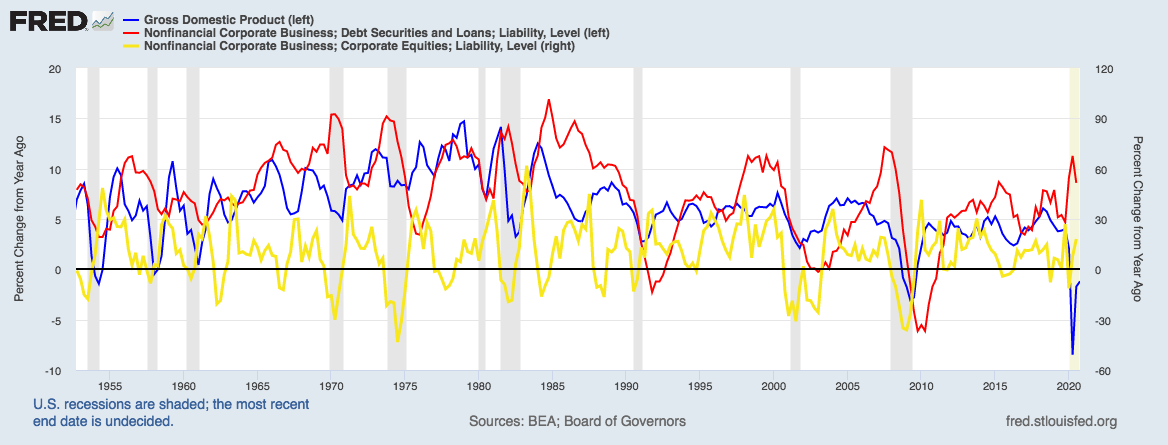
The image shows a graph depicting the number of U.S.
Read full description
The image shows a graph depicting the number of U.S. GDP growth in the past decade, with the text "Gross Domestic Product" at the top. The graph is composed of different colored lines, each representing a different year, and the y-axis is labeled with the GDP growth rate. The colors range from light blue to dark blue, indicating the different levels of GDP growth.