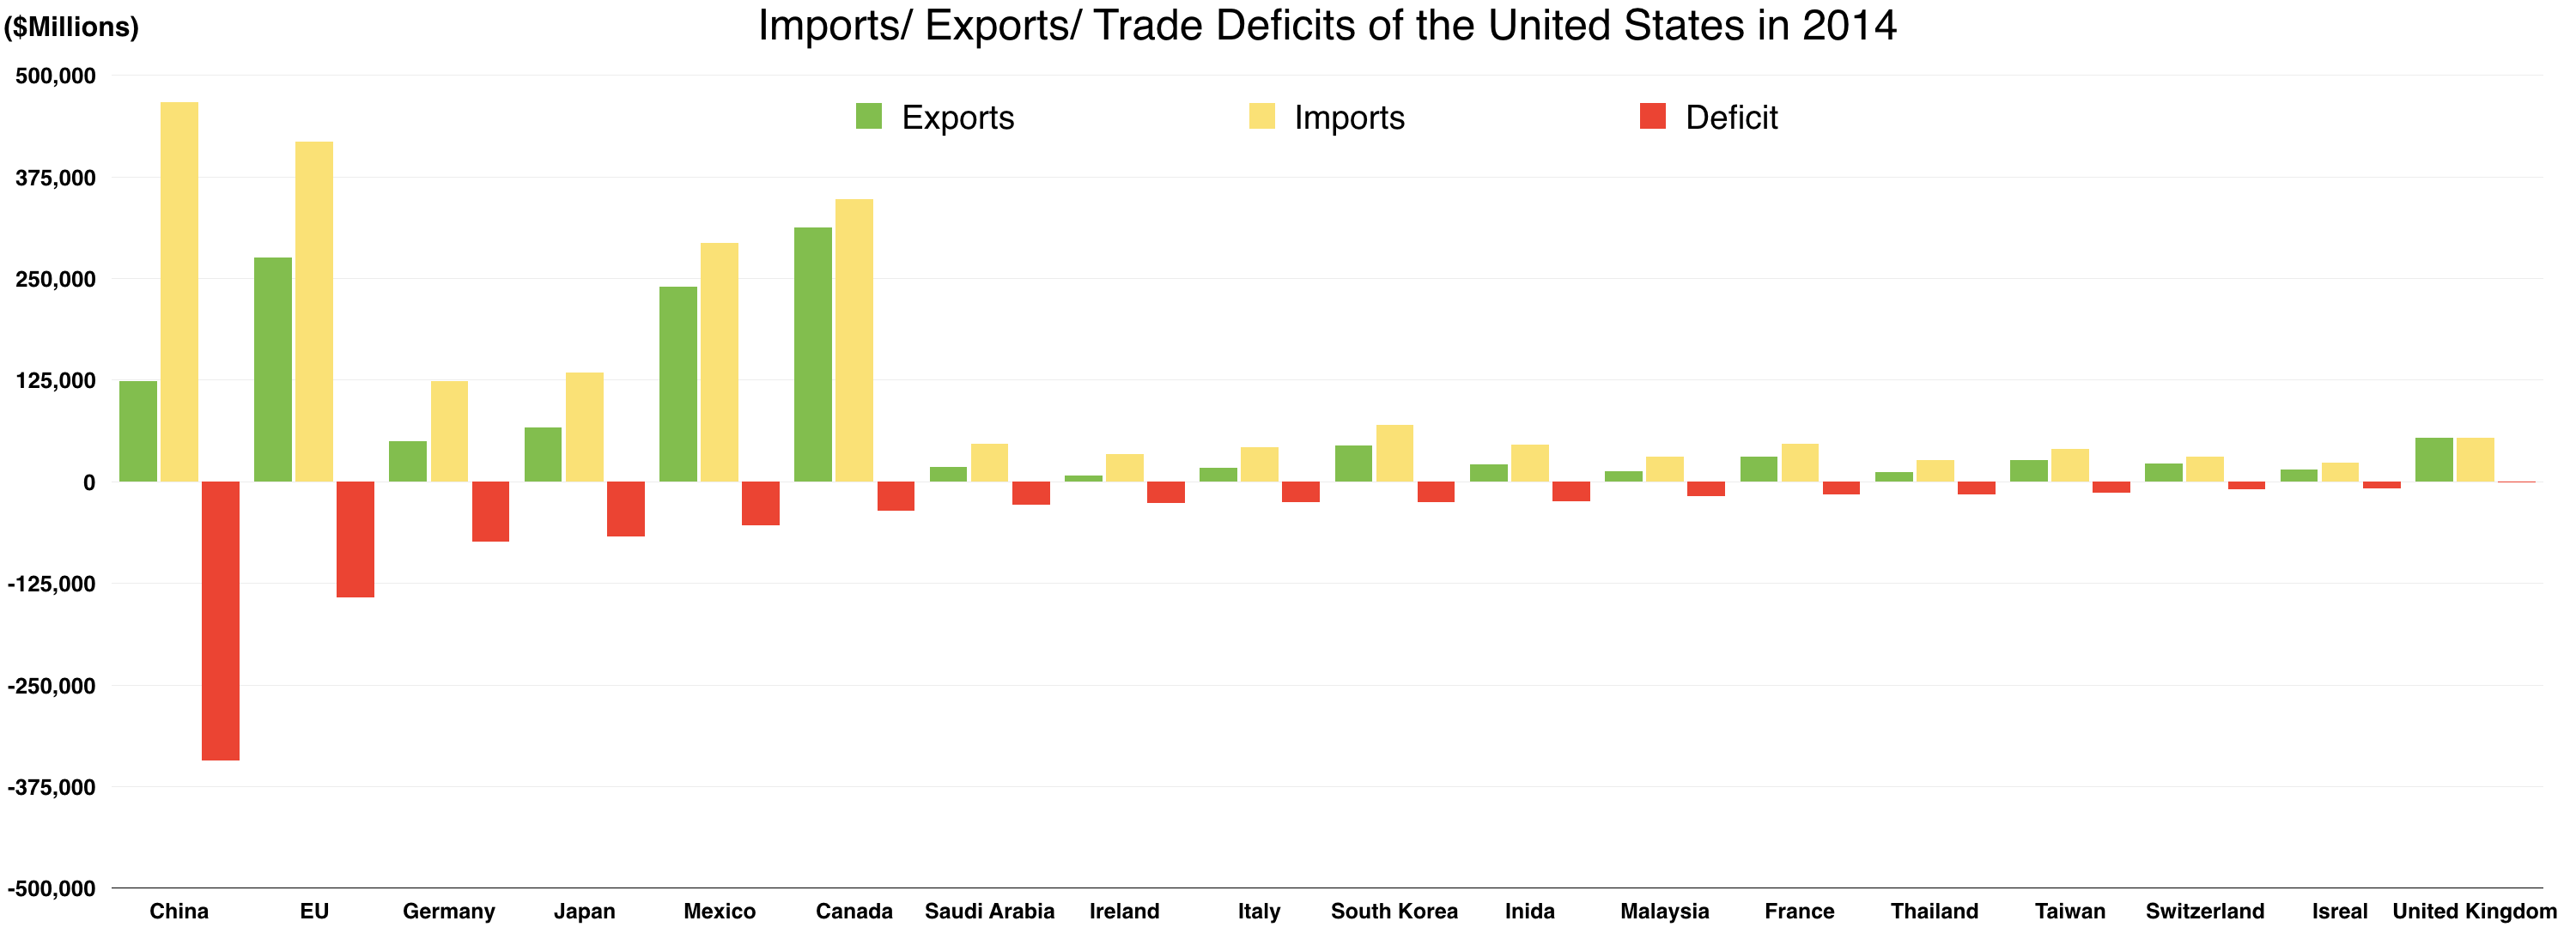
The image shows a bar chart depicting the number of imports and exports in the United States in 2014.
Read full description
The image shows a bar chart depicting the number of imports and exports in the United States in 2014. The chart is composed of different colored blocks, each representing a different country, and the text at the top of the chart provides further information about the data.