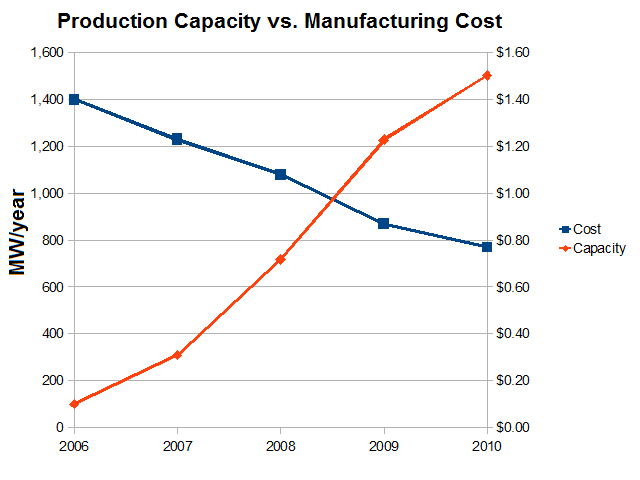
The image shows a graph on a white background with text that reads "Production Capacity vs Manufacturing Cost".
Read full description
The image shows a graph on a white background with text that reads "Production Capacity vs Manufacturing Cost". The graph is divided into two sections, one for production capacity and one for manufacturing cost, and each section is labeled with the corresponding production capacity. The production capacity section is represented by a blue line, while the manufacturing cost section is shown by a red line. Both sections are labeled with numerical values, indicating the cost of each section.