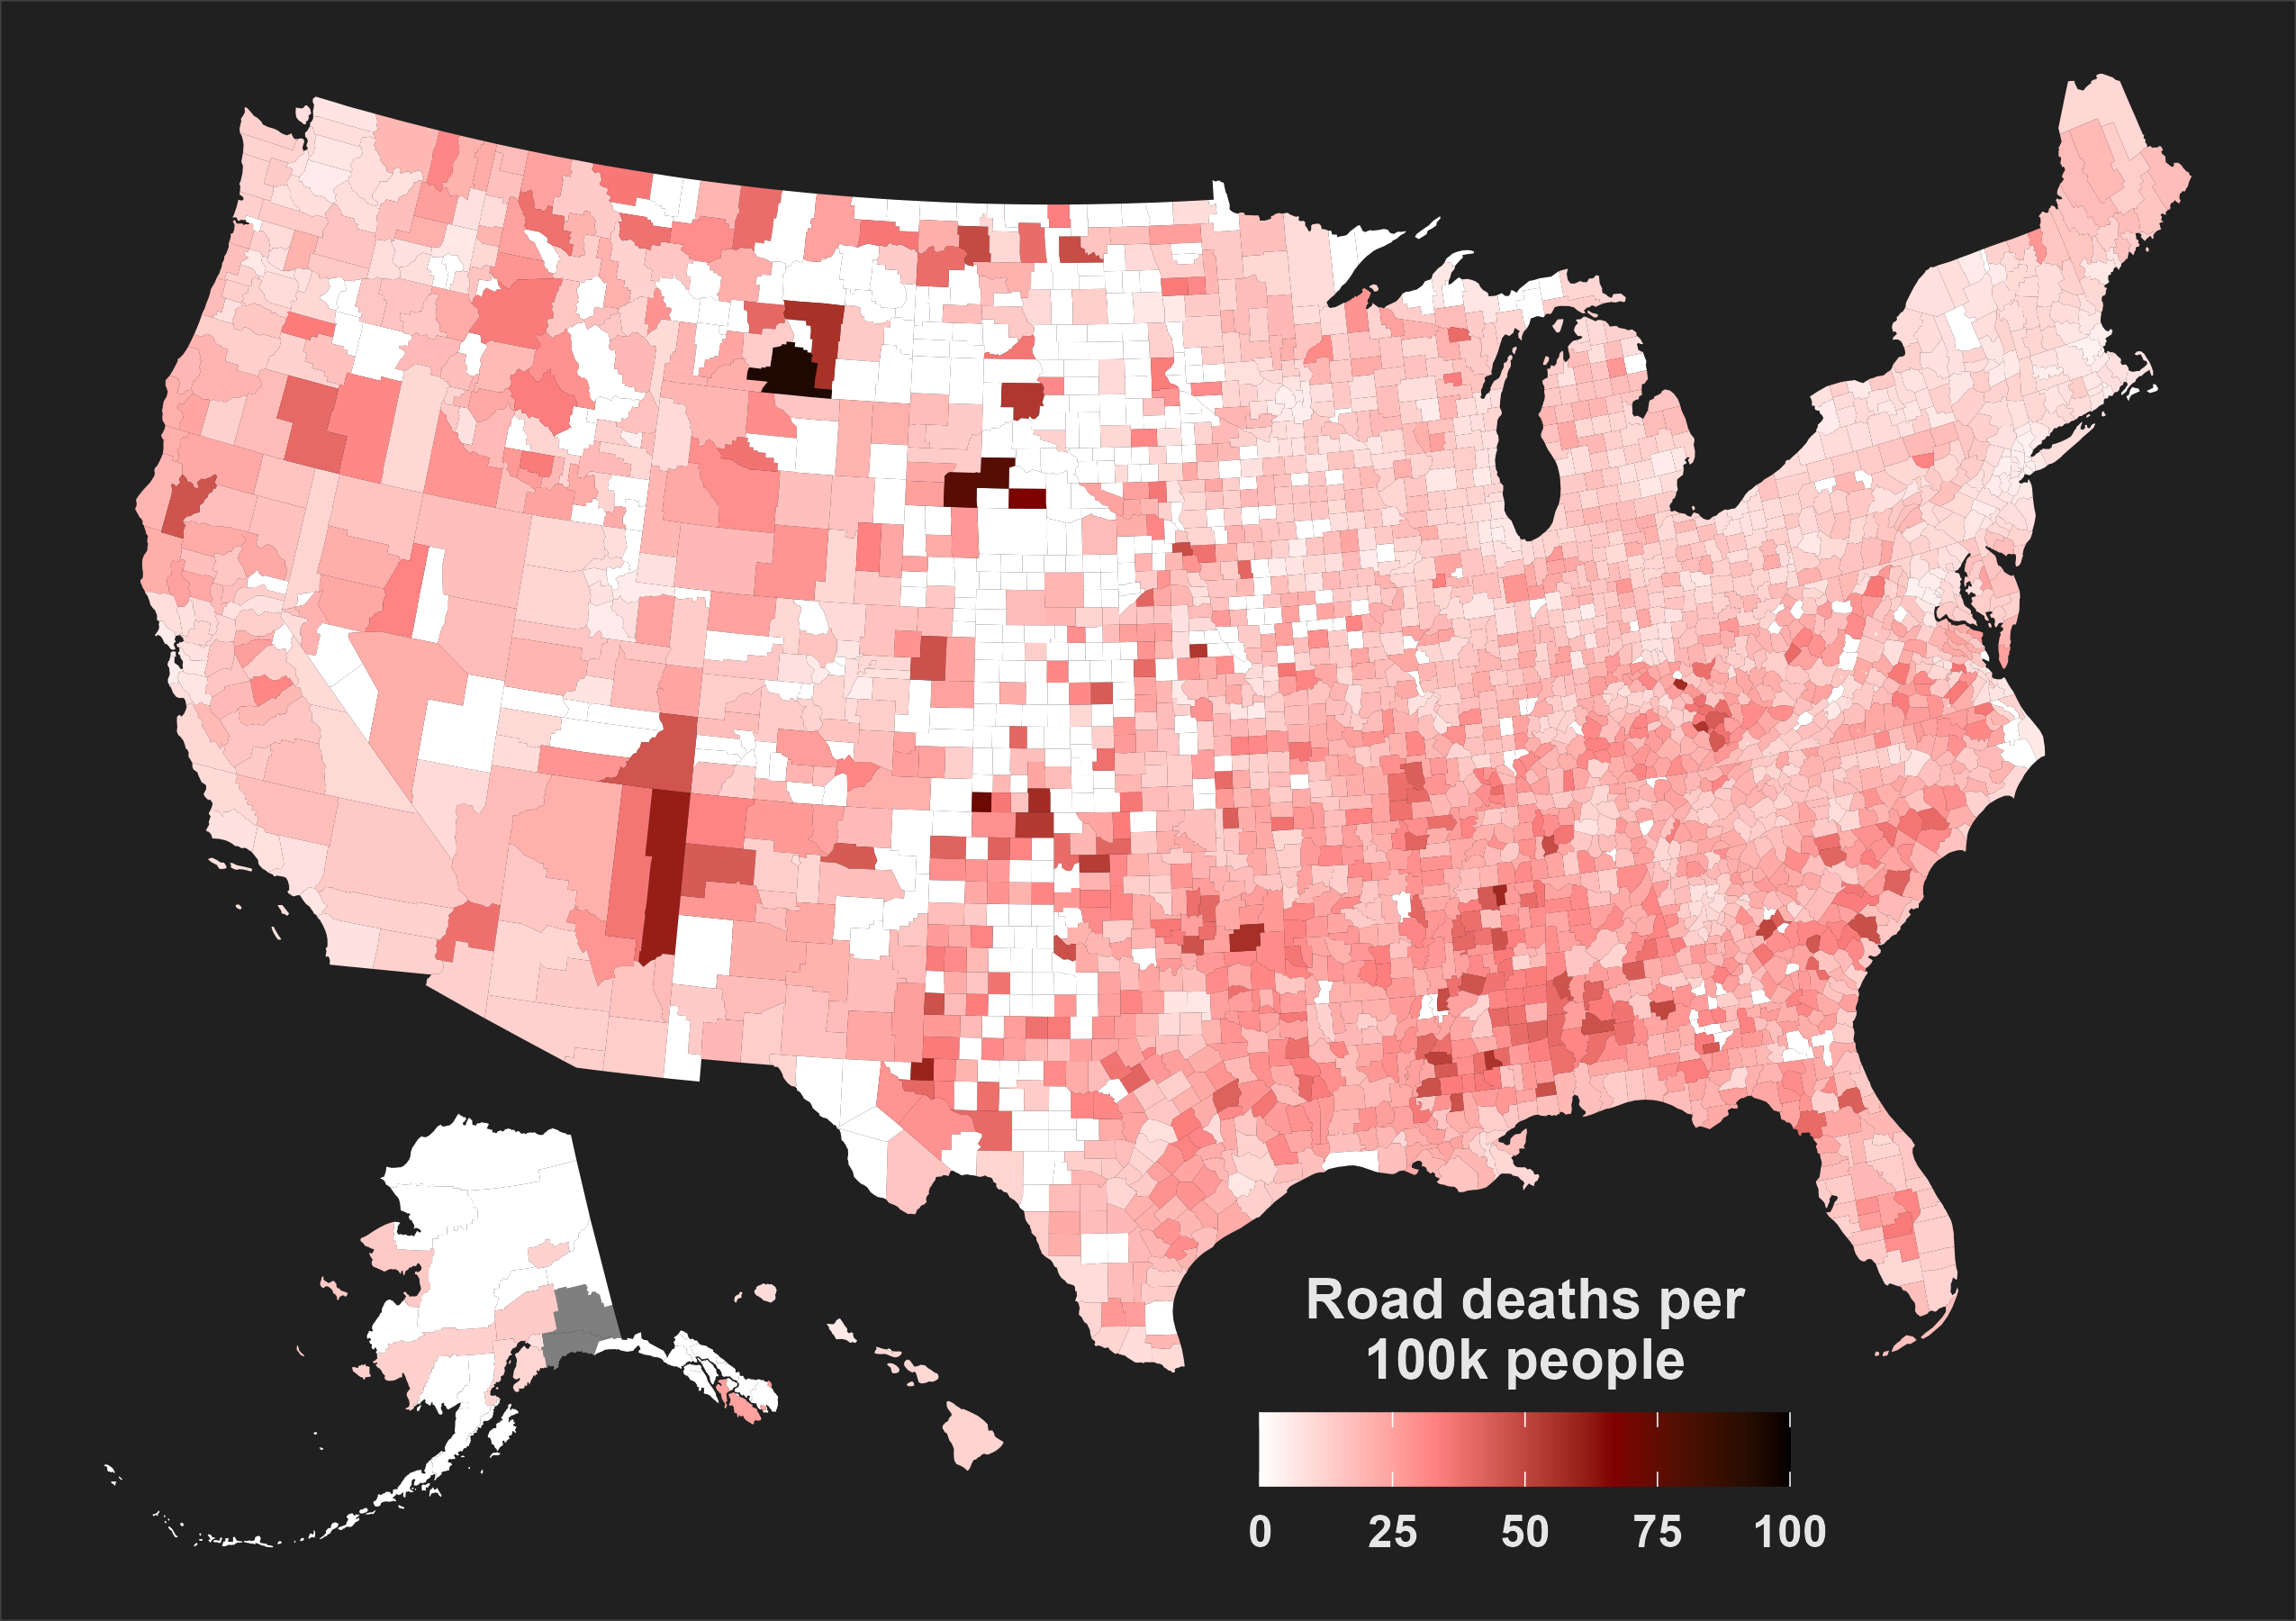
The image shows a map of the United States with the percentage of road deaths per 100k people in each state.
Read full description
The image shows a map of the United States with the percentage of road deaths per 100k people in each state. The map is divided into different colors, with darker colors representing higher road deaths and lighter colors representing lower road deaths. Text and numbers are also visible on the map, providing further information about the data.