Public domain photos
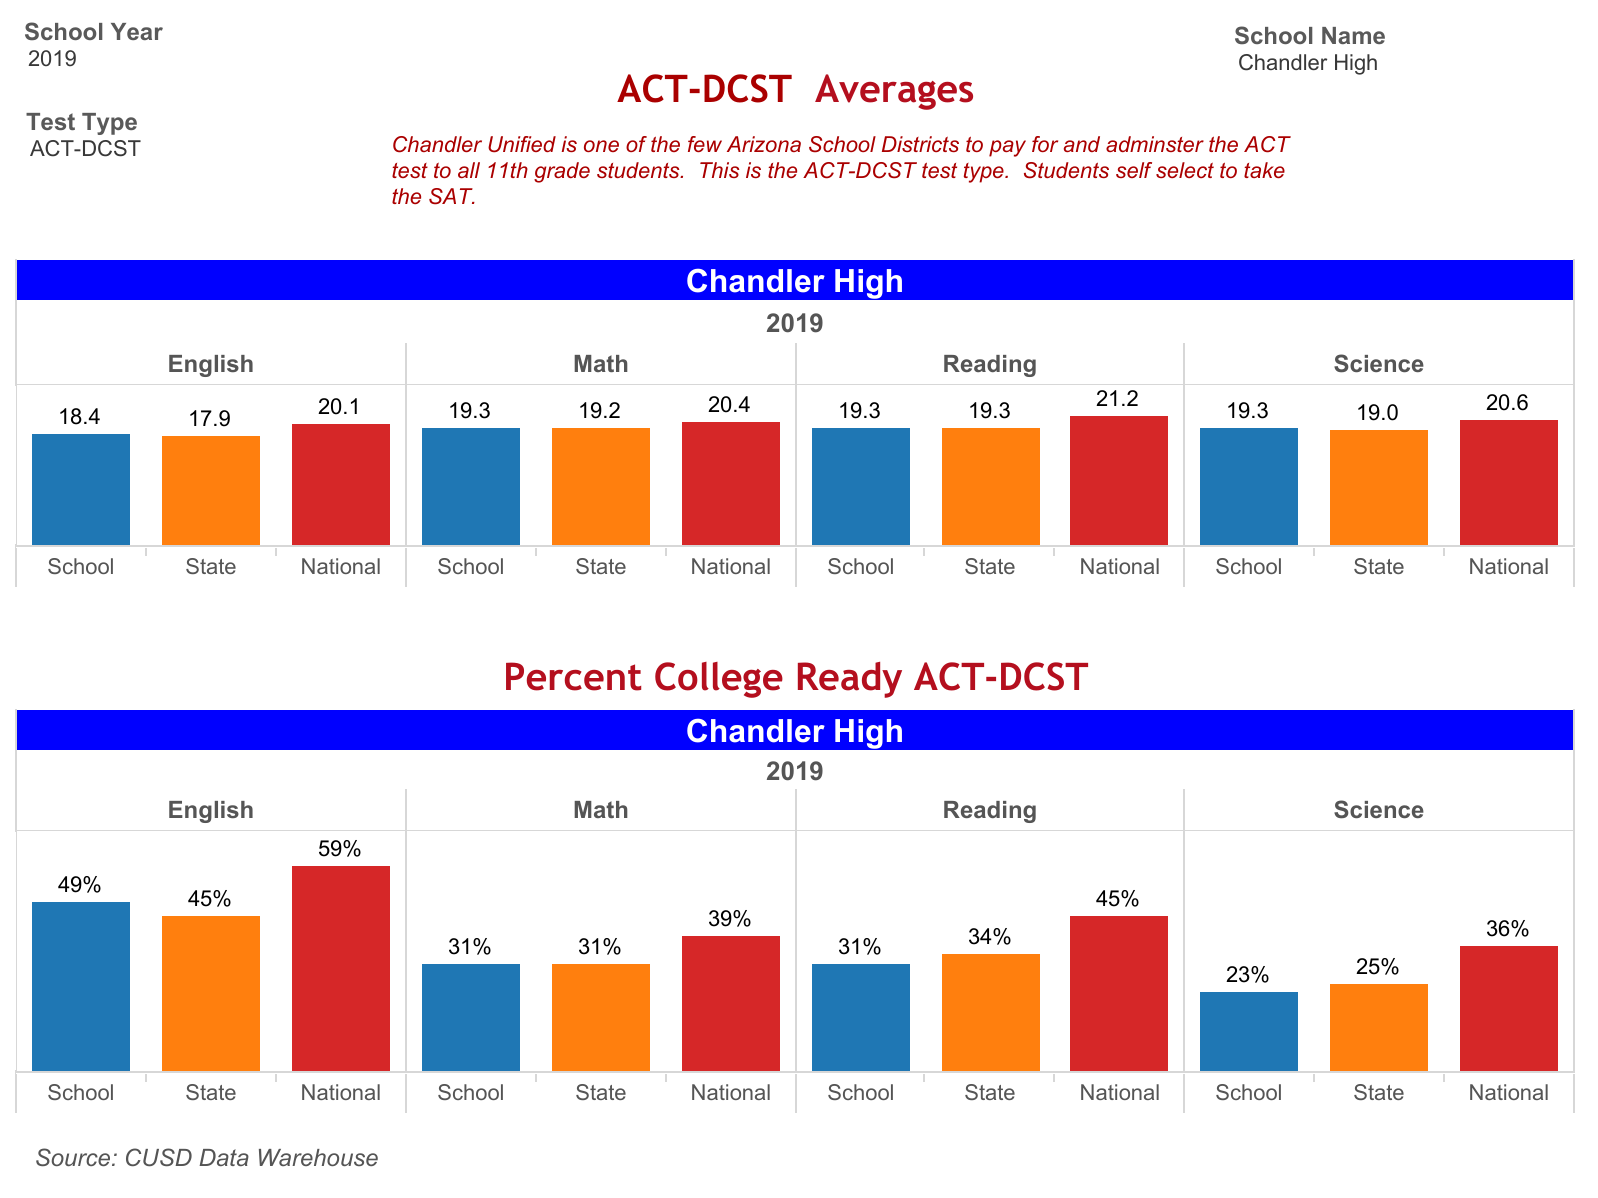
The image shows a bar chart depicting the percentage of students who have been enrolled in the ACT-DCST program. The chart is divided into sections, each representing a different year, and the height of each section indicates the percentage. The text at the top of the chart provides additional information about the data.
 Open in library