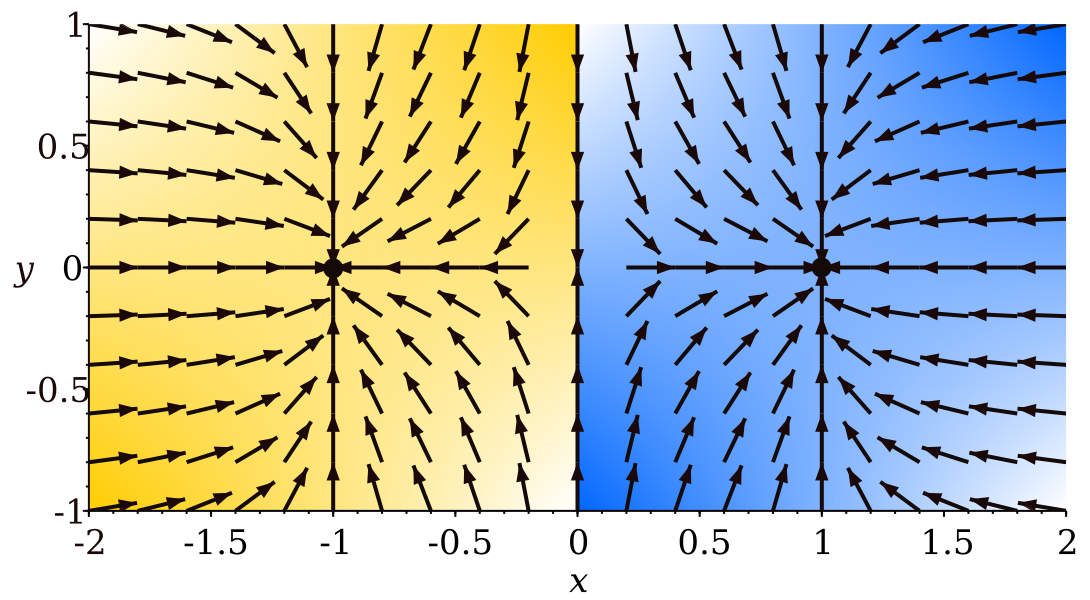
The image shows a plot of a waveform with a blue and yellow color scheme, and a plot showing the distribution of the waveform.
Read full description
The image shows a plot of a waveform with a blue and yellow color scheme, and a plot showing the distribution of the waveform. At the bottom of the image, there is text indicating that the image is a representation of the fourier waveform, which is a type of waveform that is composed of a series of concentric circles that are connected by a central point at the center. The x-axis of the plot is labeled with the number of waves, while the y-axis is labeled as the amplitude of the waves. The colors of the circles vary, with the blue representing the waveforms and the yellow representing the amplitude.