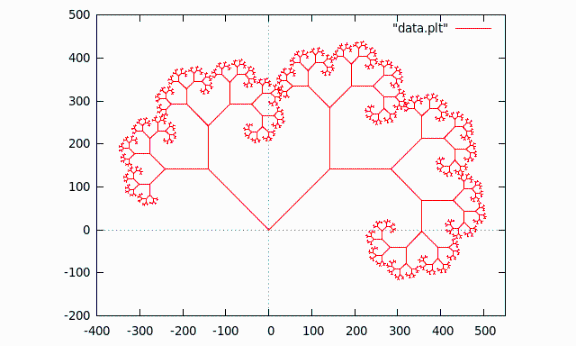
The image shows a plot with a red line in the middle of it, which is a scatter plot of the number of people who have been diagnosed with cancer.
Read full description
The image shows a plot with a red line in the middle of it, which is a scatter plot of the number of people who have been diagnosed with cancer. The plot is composed of a series of interconnected lines, each representing a different number of patients, and the red line is used to indicate the correlation between the two.