Read full description
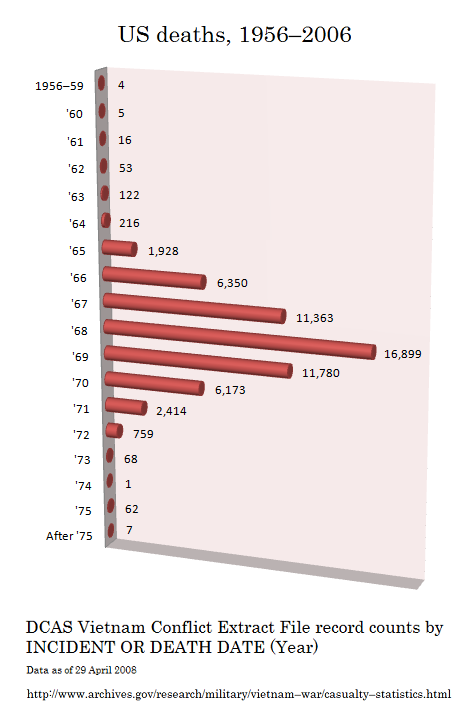
The image shows a graph depicting the US deaths from 1956 to 2006, with the text "DCAS Vietnam Conflict Extract File Record Counts by Incident or Death Date" at the top and bottom. The graph is composed of several bars of varying heights, each representing a different year, with each bar representing the number of deaths in that year. The bars are labeled with the corresponding year, and the height of each bar indicates the amount of deaths.