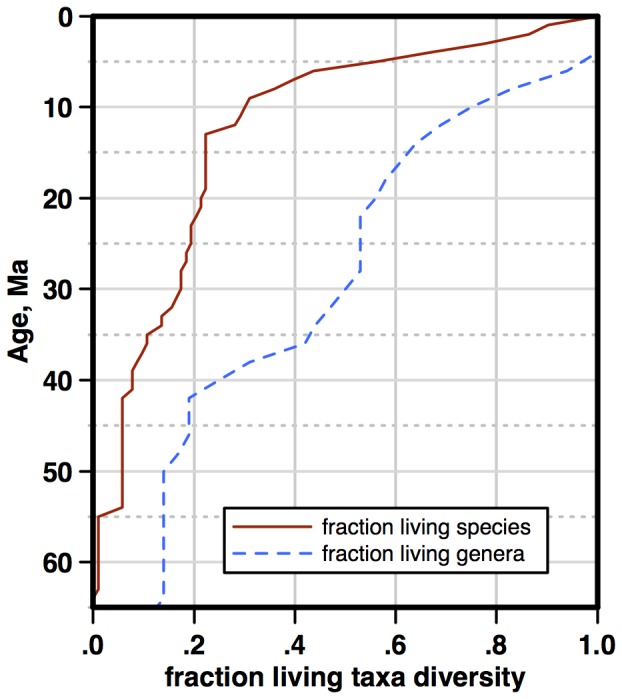
The image shows a graph depicting the correlation between fraction living and taxa diversity.
Read full description
The image shows a graph depicting the correlation between fraction living and taxa diversity. The graph is divided into two sections, one labeled "Fraction Living" and the other labeled "Taxa Diversity". The x-axis of the graph is labeled "Age" and contains numerical values, while the y-axis is labeled with numerical values.