Public domain photos
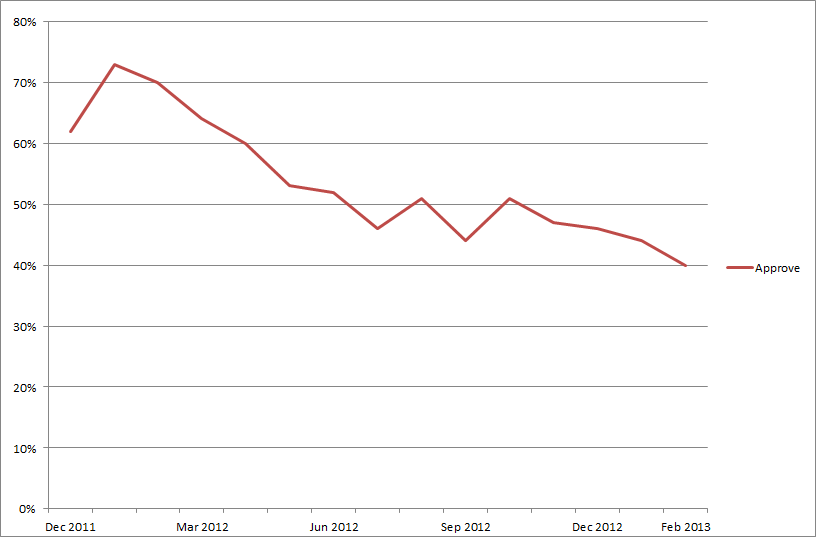
The image shows a graph on a white background with text that reads "S&P 500 Index Approved by Month". The graph displays the index's performance over a period of time, with the x-axis representing the months and the y-axis indicating the index. The graph shows a steady increase in the index over the course of the month, indicating that the index has been steadily increasing over the past few months.
 Open in library