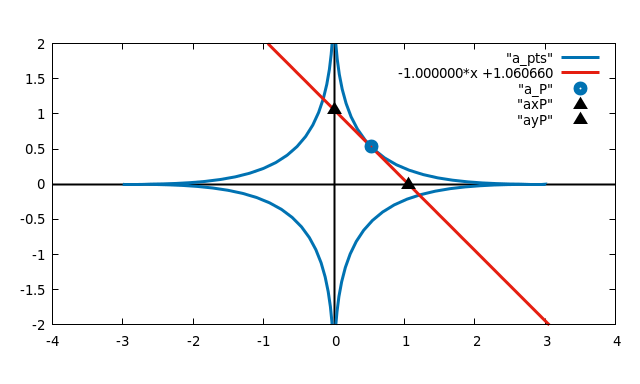
The image shows a plot of a function with a red line and a blue line on a white background.
Read full description
The image shows a plot of a function with a red line and a blue line on a white background. The text on the image reads "Figure 1: The function of the x-axis and y-axis of the function is represented by two lines, one in blue and one in red. The blue line is curved and the red line is straight, indicating the relationship between the two lines.