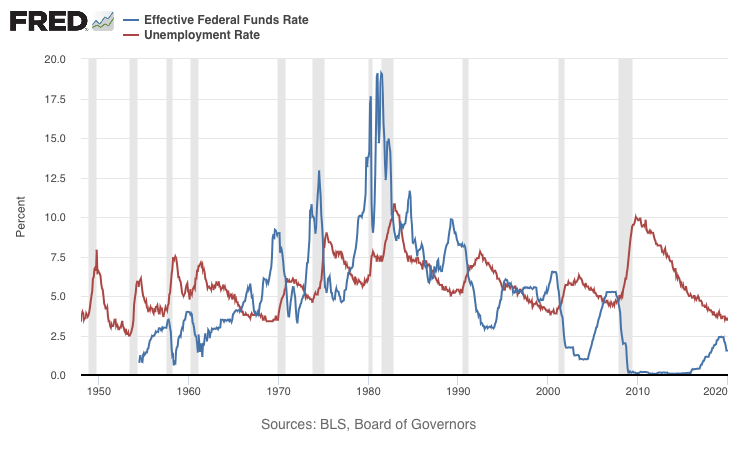
The image shows a graph depicting the effective federal funds rate and unemployment rate.
Read full description
The image shows a graph depicting the effective federal funds rate and unemployment rate. The graph is composed of two lines, one in blue and one in red, that represent the rate of unemployment in the United States. The blue line is steadily increasing, indicating a decrease in the rate over time. The red line is slightly higher than the blue line, indicating an increase in unemployment rate over the course of the year. The text on the graph reads "Effective Federal Funds Rate and Unemployment Rate".