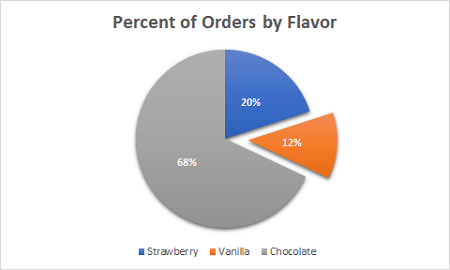
The image shows a pie chart depicting the percentage of orders by flavor.
Read full description
The image shows a pie chart depicting the percentage of orders by flavor. The chart is divided into sections, each representing a different flavor, such as strawberry, vanilla, and chocolate. The text accompanying the chart provides further information about the percentages.