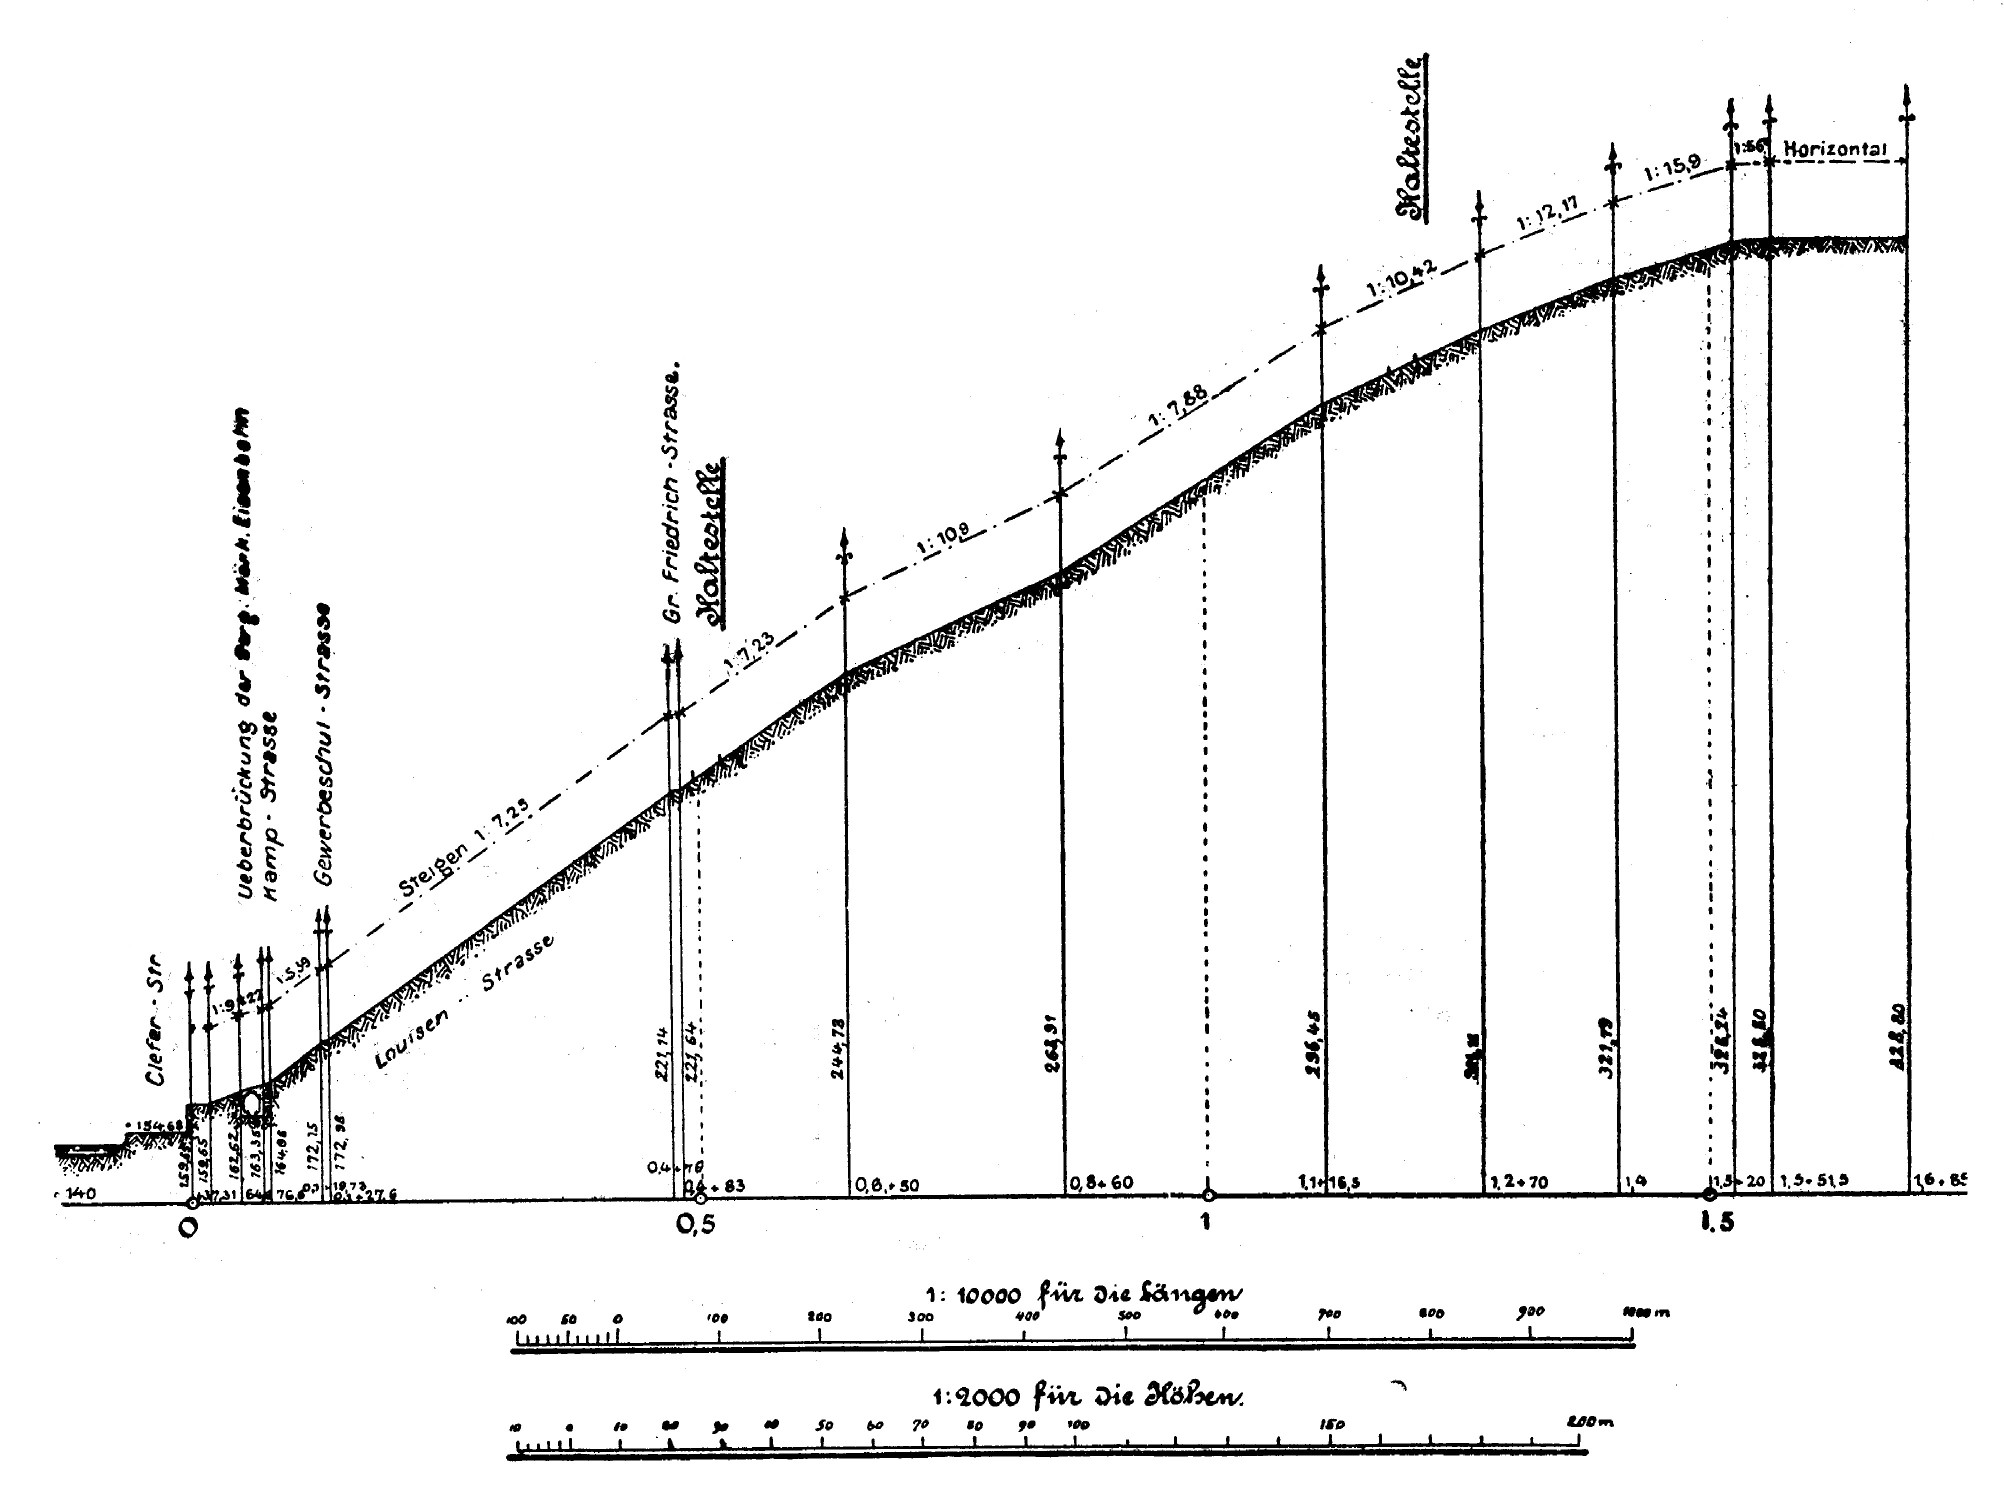
The image shows a graph depicting the growth of the number of people who have lived in the United States over a period of time.
Read full description
The image shows a graph depicting the growth of the number of people who have lived in the United States over a period of time. The graph is composed of a series of points connected by a line, with the x-axis representing the time period and the y-axis indicating the height of the population. The points are labeled with the names of the people living in each point, and the graph also includes a legend that explains the meaning of each point.