Read full description
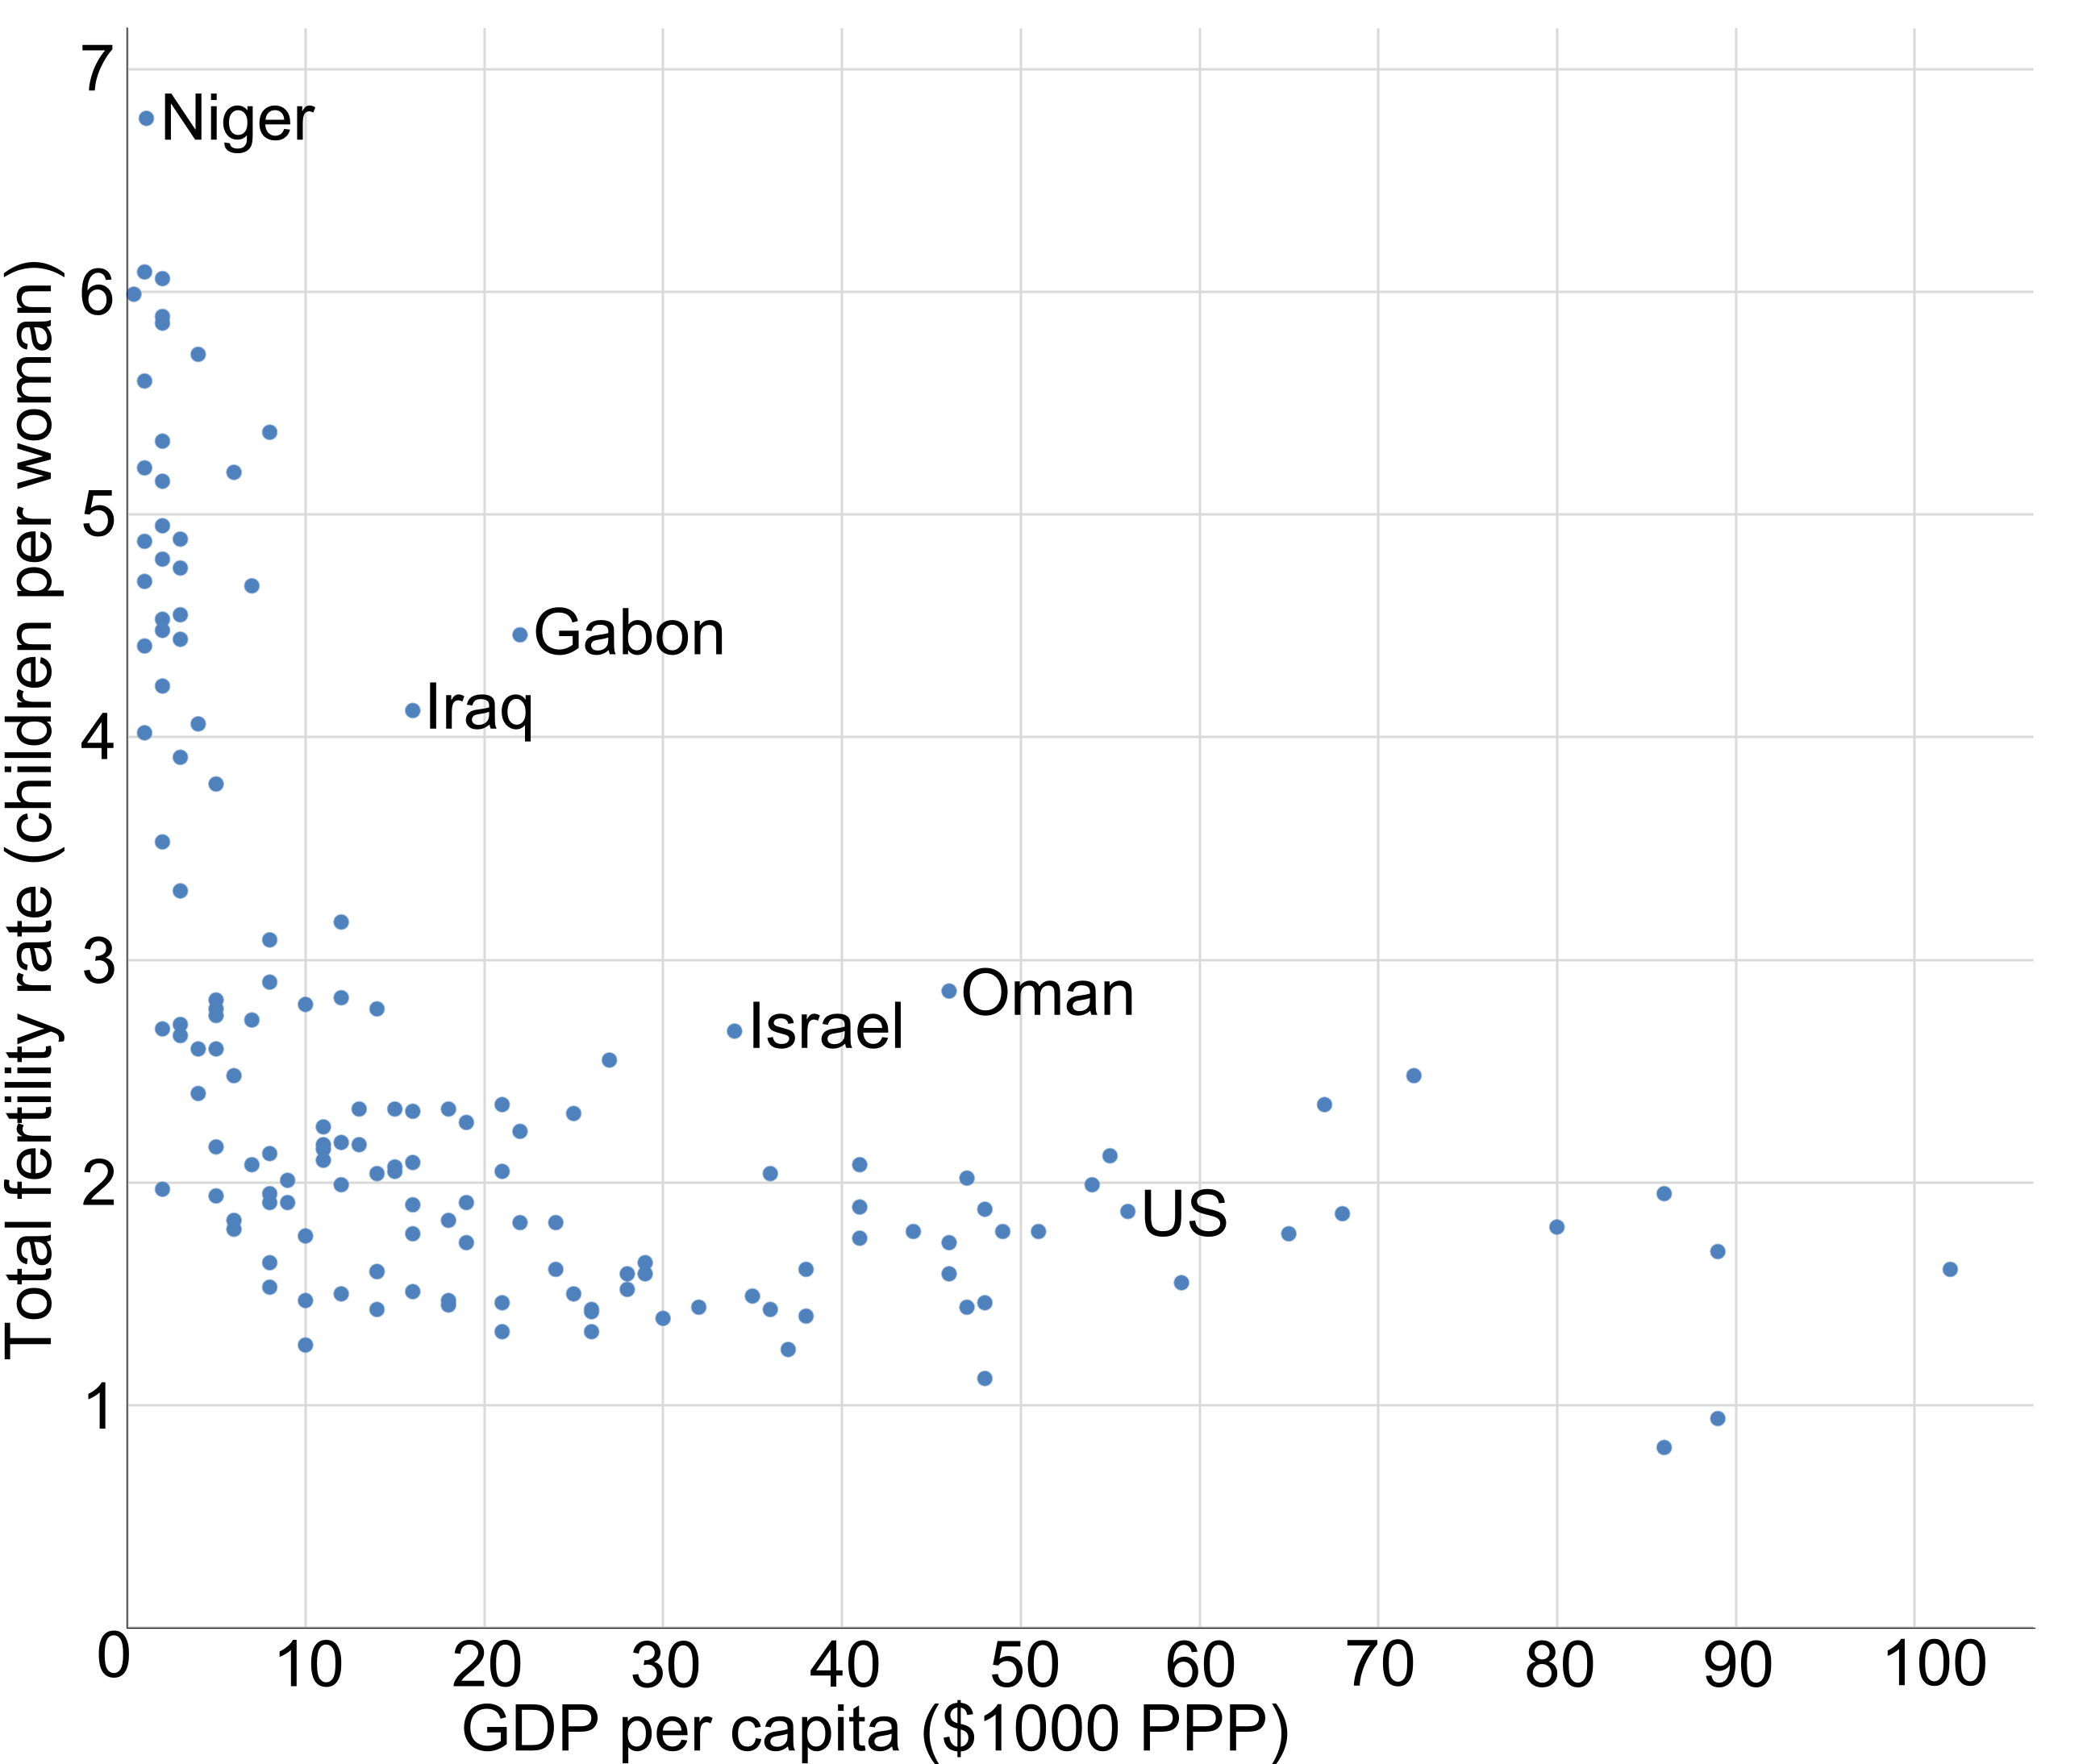
The image shows a scatter plot with a white background, displaying the correlation between the GDP per capita and the number of people who have been diagnosed with cancer. The plot is composed of blue dots and text, providing a visual representation of the data.