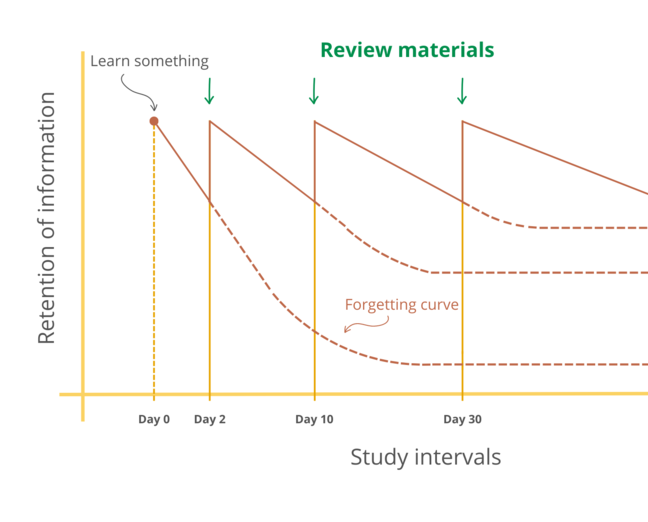
The image shows a graph depicting the relationship between review materials and study intervals.
Read full description
The image shows a graph depicting the relationship between review materials and study intervals. The graph is divided into two sections, one labeled "Review Materials" and the other labeled "Study Intervals". The x-axis of the graph is labeled with the days of the week, while the y-axis is labeled as the duration of the study intervals, ranging from 0 to 30 minutes.