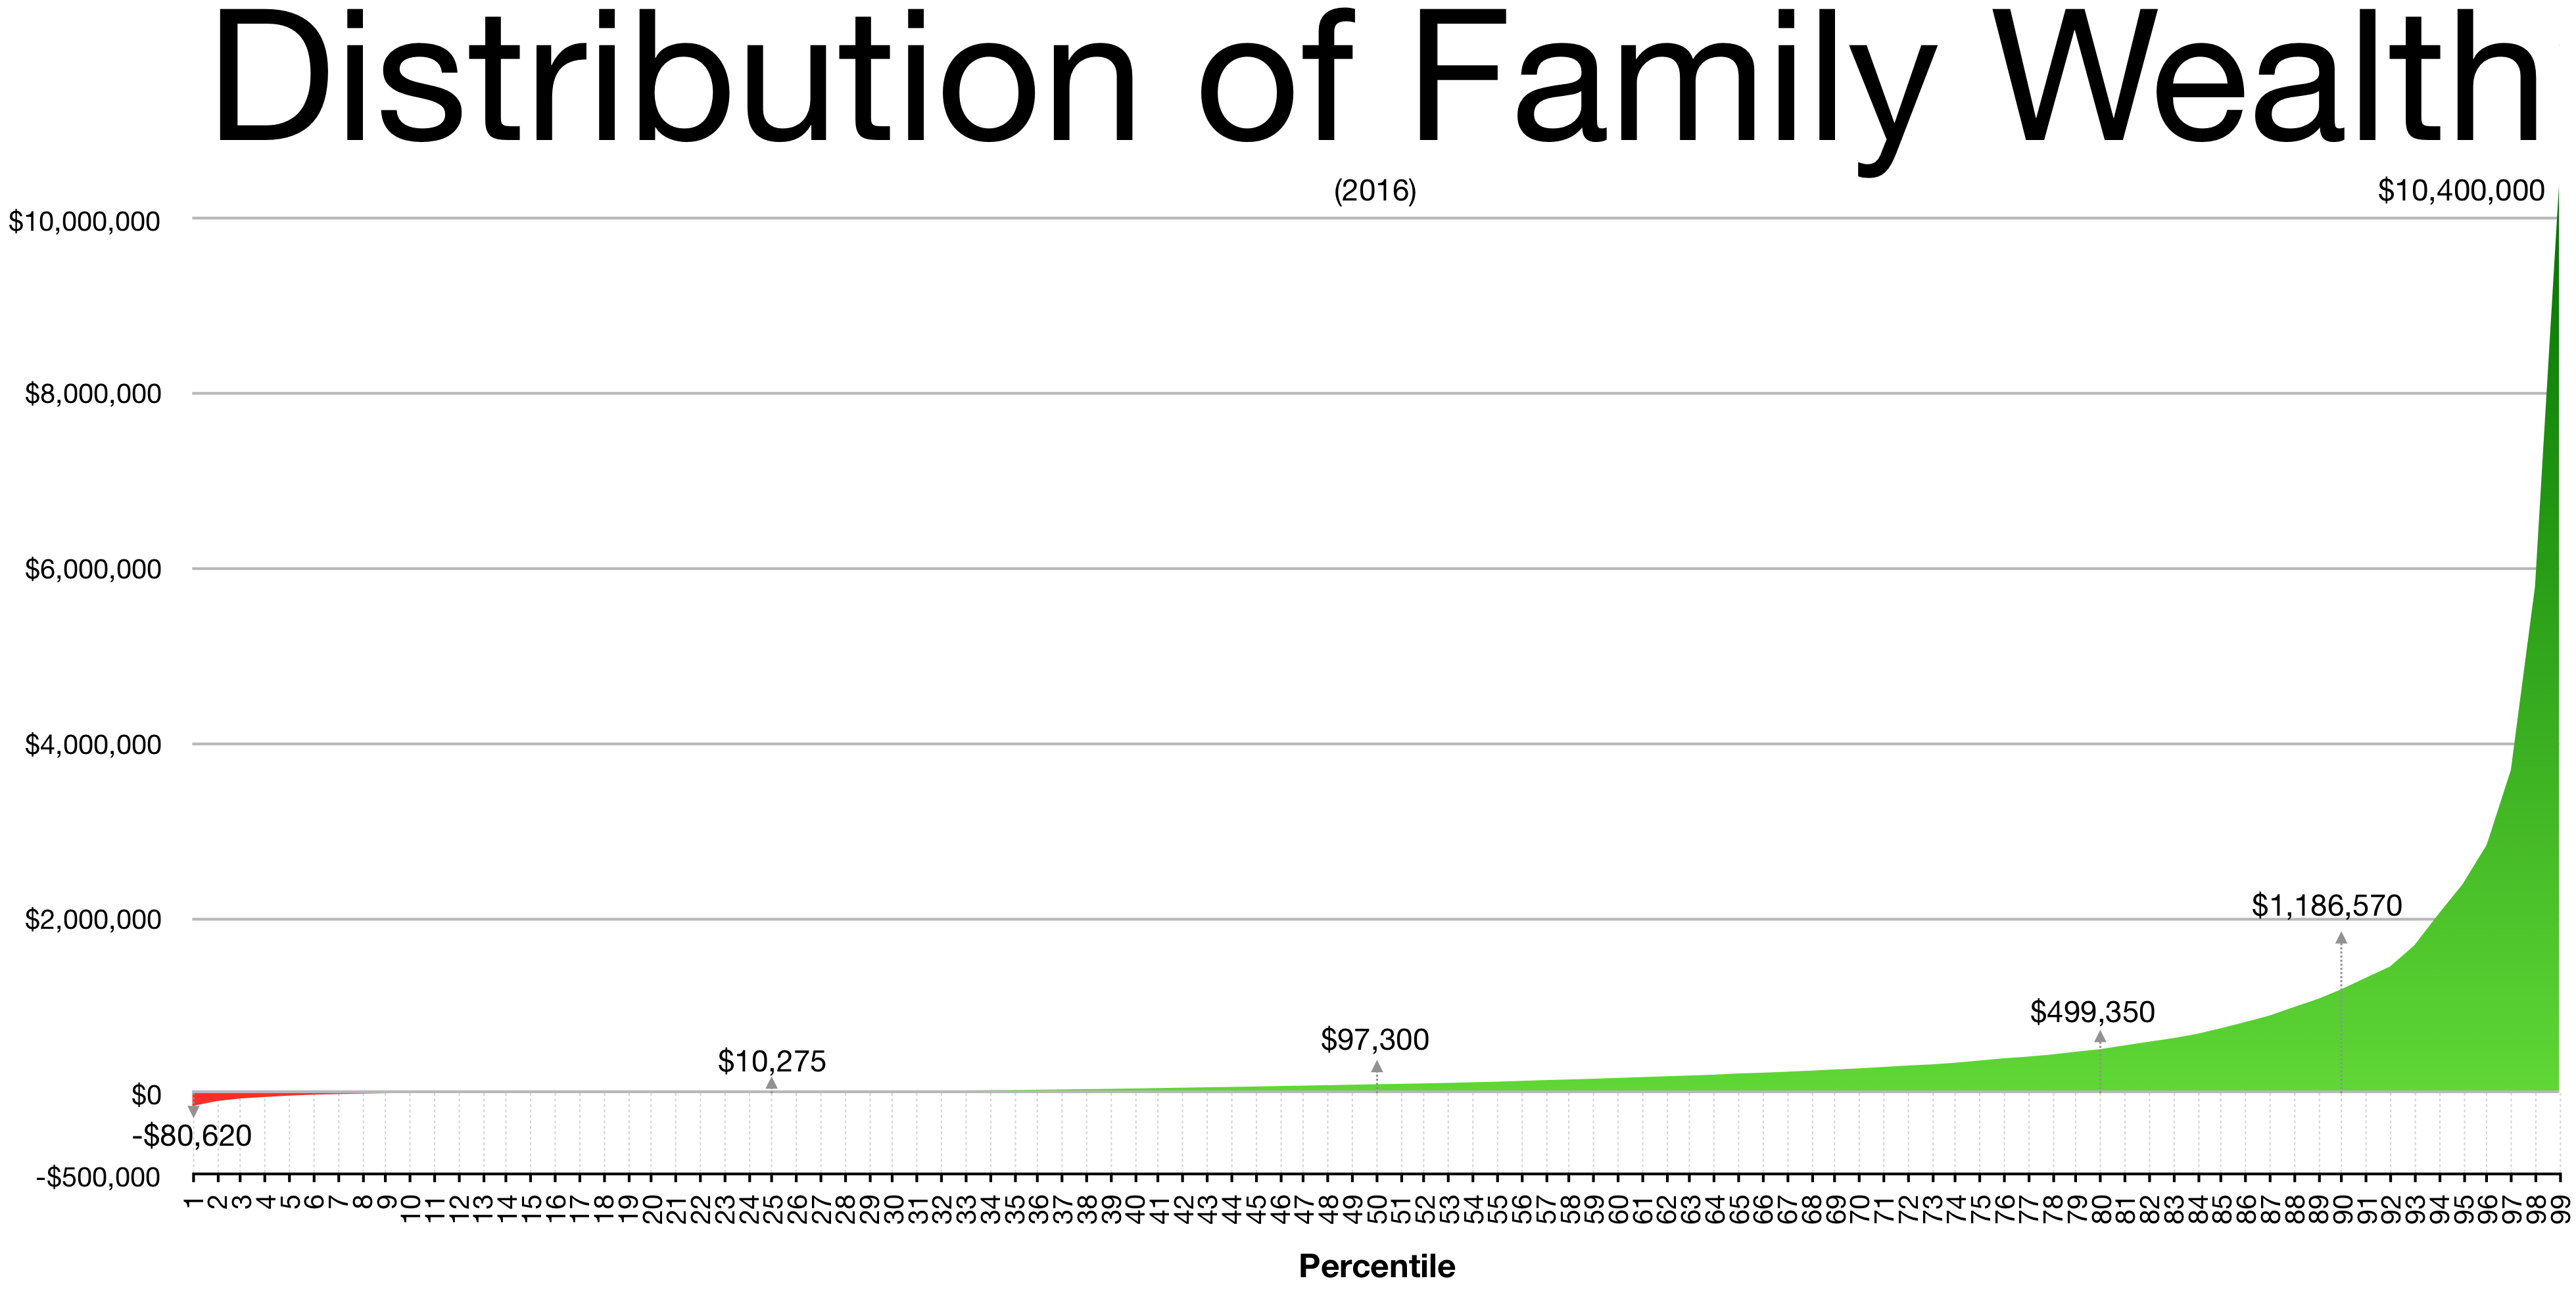
The image shows a graph depicting the distribution of family wealth, with text at the top and bottom of the image.
Read full description
The image shows a graph depicting the distribution of family wealth, with text at the top and bottom of the image. The graph is composed of a series of bars, each representing a different year, with the height of each bar indicating the amount of money spent on each year. The bars are labeled with the corresponding year, and the y-axis is labeled with numerical values.