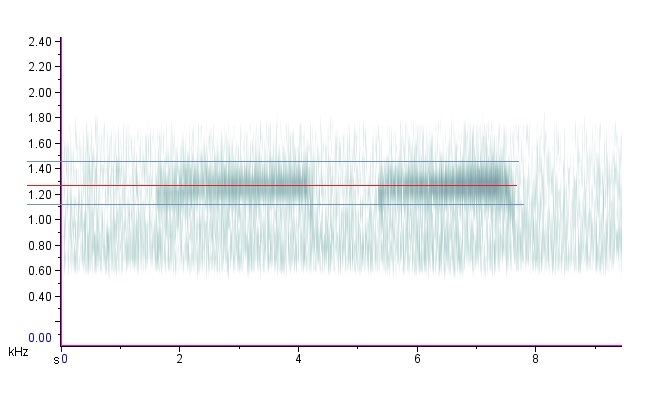
The image shows a plot of a waveform with a red line in the middle, indicating the frequency of the waveform.
Read full description
The image shows a plot of a waveform with a red line in the middle, indicating the frequency of the waveform. The graph is composed of a series of points connected by a line, with the x-axis representing the frequency and the y-axis indicating the current. The line is colored in shades of blue, green, and red, indicating a range of frequencies.