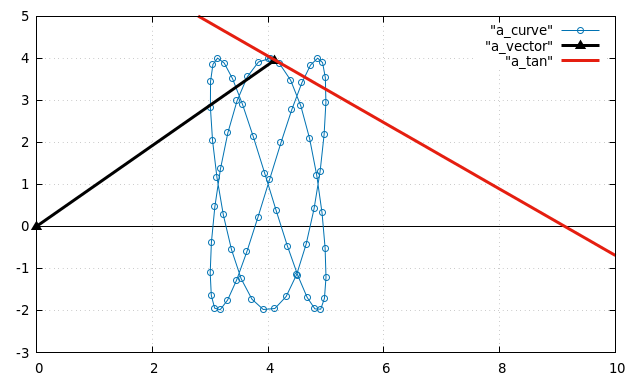
The image shows a graph with a blue line and a red line on a white background.
Read full description
The image shows a graph with a blue line and a red line on a white background. The graph is a vector-a-tan curve, which is used to illustrate the relationship between the two variables. The blue line is curved and the red line is straight, indicating the direction of the curve. The white background provides a stark contrast to the blue line, making the graph stand out.