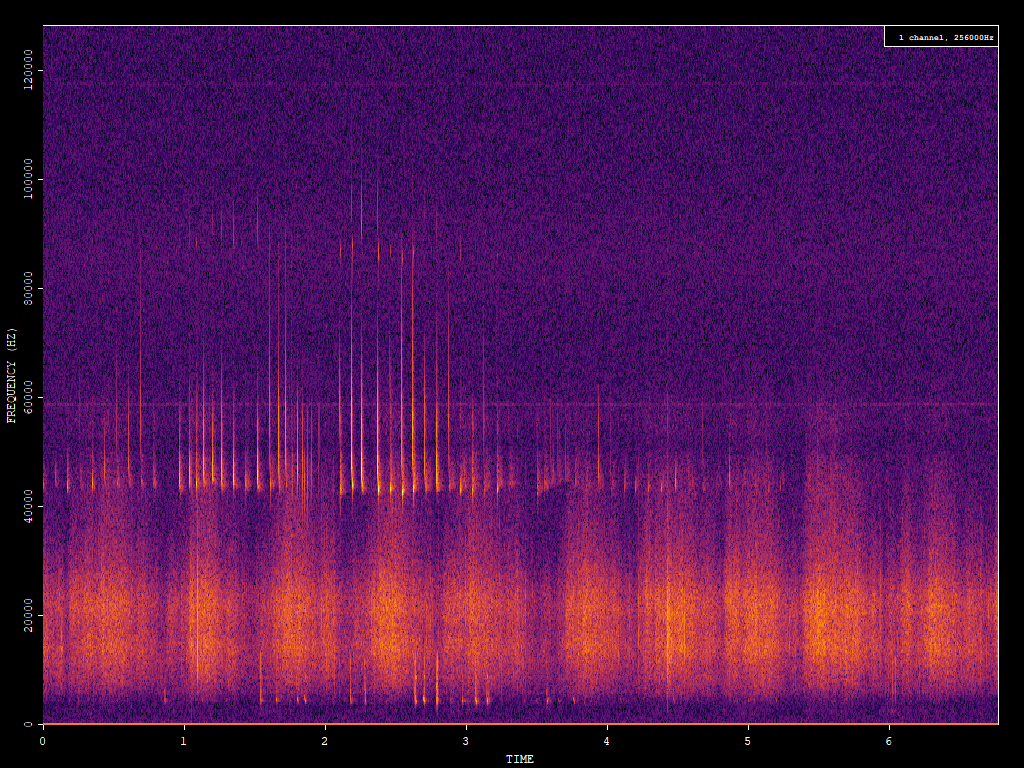
The image shows a plot of a waveform with a purple and orange color scheme.
Read full description
The image shows a plot of a waveform with a purple and orange color scheme. The waveform is composed of a series of concentric circles, each representing a different frequency. The colors range from light blue to dark blue, with the lightest blue representing the highest frequency and the darkest blue representing lower frequency.