Read full description
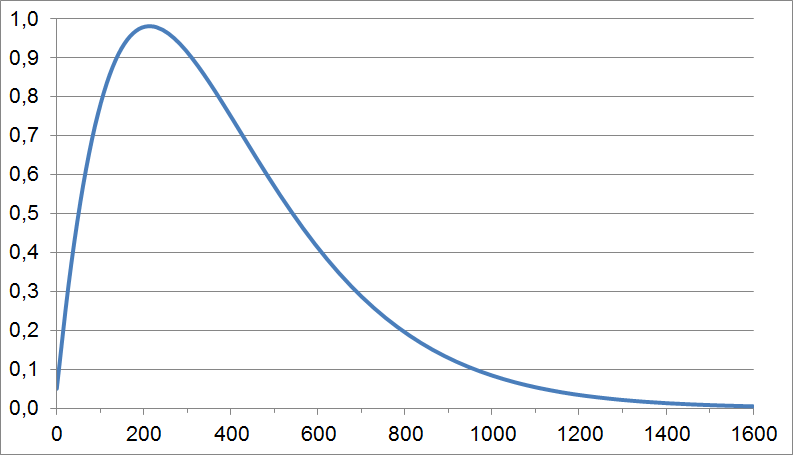
The image shows a graph of the number of people who have been diagnosed with cancer, with the x-axis representing the time period and the y-axis indicating the amount of time. The graph is displayed on a computer screen, providing a visual representation of the data.